Sulfonamides (SAs) are a class of synthetic antimicrobial compounds with a broad spectrum. As shown in Figure 1, they all contain the same chemical structure of an unsubstituted amino on a benzene ring and a sulfonamide group para to the amino.1 SAs have the advantages of fast absorption, good bioavailability, high drug concentration, wide distribution in the body, strong antibacterial action, long residence time, and no effect on the host in organisms. Thus, they are commonly used in poultry for prophylactic, therapeutic, and growth promotion purposes, especially in the treatment of poultry coccidiosis and fowl cholera.2‒4
 Figure 1 ‒ Chemical structures of six sulfonamide antibiotics analyzed in this work.
SAs are administered orally or are mixed with animal feed and water; however, the unreasonable and extensive use of sulfonamides can result in high levels of SA residues in edible animal products like meat, milk, egg, and fish. This becomes a major concern for consumers due to issues of possible allergic effects and problems with drug resistance. It has been reported that one or more members of this drug class even show potential carcinogenic characteristics.5‒8 The European Union Commission has set a maximum residues level of 100 ng mL‒1 in edible animal tissue.9 As such, there is an urgent need to establish a sensitive and selective method for monitoring the residue levels of SAs in edible animal products.
Some analytical methods have been developed for determination of SAs in food, including HPLC,10‒12 GC,13 and capillary electrophoresis (CE).14‒16 Among these, HPLC is the most popular technique, and has been used to detect SA residues in animal meat,17 milk,18,19 and eggs.20 However, HPLC has the disadvantages of complicated operation, long analysis time, and large solvent consumption.
The aim of this work was to develop a simple, inexpensive, and easy-to-handle method to analyze SA residues in animal tissue samples.
CE is a recently developed analytical tool for food analysis. It has become a rapid, sensitive, and versatile separation technique for the analysis of a wide variety of species, including inorganic compounds, neurotransmitters, organic acids, amino acids, and proteins.21 CE has the advantages of relatively short analysis time, low sample and reagent consumption, ease of automation, high separation efficiency, and flexible applications. Several detection techniques have been explored to couple with CE, such as chemiluminescence,22 ultraviolet/visible absorption (UV/VIS),23 mass spectrometry,24 laser-induced fluorescence (LIF),25 and electrochemical detection.26 To date, a UV/VIS absorption-based detector can be considered the most popular CE detector because of its simplicity and flexibility. However, the limit of detection (LOD) is still far from satisfactory since the detection is limited by the short pathlength through the column.
To improve this, the LIF detector was developed and has been become the most sensitive CE detector. However, the cost of a commercially available LIF detector is relatively high. Recently, a light-emitting diode (LED)-IF detector has been proposed since it is more cost-effective, and more choices of excitation wavelengths are allowed for use.27,28
In the present work, a highly sensitive CE method coupled with in-column fiber-optic light-emitting diode-induced fluorescence detector (ICFO-LED-IFD) was set up to separate and analyze six SAs, including sulfaguanidine (SGD), sulfanilamide (SNM), sulfadimidine (SDD), sulfamerazine (SMZ), sulfadiazine (SDZ), and sulfaclozine (SCZ) in animal tissue. The experimental conditions for the analysis of SAs were systematically investigated. Finally, the optimal CE-ICFO-LED-IFD conditions have been successfully applied to determine the six SAs in spiked chicken liver samples with satisfactory results.
Experimental
Chemicals and reagents
Sulfaguanidine, sulfadimidine, and sulfadiazine were purchased from Aladdin Reagent Co. (Shanghai, China). Sulfamethazine, sulfaclozine, and fluorescein isothiocyanate (FITC) were obtained from Sigma Chemical Co. (St. Louis, MO). Sulfanilamide, anhydrous sodium sulfate, n-hexane, isopropyl alcohol, and sodium borate decahydrate (Na2B4O7 · 10H2O) were from Tianjin Kermel Chemical Reagents Development Centre (Tianjin, China). HPLC-grade acetonitrile, methanol, and acetone were obtained from Shandong Yuwang Industrial Co., Ltd. (Yucheng, Shandong, China). All chemicals and organic solvents used in this work were of analytical grade unless otherwise stated. Water used throughout this study was purified using a Milli-Q water purification system (Millipore, Bedford, MA).
Apparatus
Experiments were performed on a home-built CE coupled ICFO-LED-IFD, which was previously described.29 In brief, CE separation was conducted in an uncoated fused-silica capillary of 75 μm i.d. (Hebei Yongnian Optical Fiber, Hebei, China). A 0–30 kV high-voltage power supply (Tianjin Dong Wen High Voltage Power Supply Plant, Tianjin, China) was applied across the capillary. The detection window was made by removing a 5-mm section of polyimide coating on the capillary. A cyan LED (Shifeng Optic and Electronics Co., Ltd., Shenzhen, China; power, 5 mW; peak wavelength, 480 nm; and spectral half-width, 25 nm) driven by a constant voltage source was used as the excitation light source. The LED light beam was focused on a bandpass filter (FF01-390/482/563/640-25, Semrock, Rochester, NY) through a double convex lens (GL12-006-010, Beijing Golden Way Scientific Co., Ltd., Beijing, China), then focused on one end of a bare 13 cm × 40 μm optic fiber (Beijing Glass Institute, Beijing, China) by a GRIN lens (Xi`an Towin Co., Ltd., Xi`an, Shaanxi Province, China).
The other end of the optical was inserted into the separation capillary to transmit the exciting light beam to the sample detection window. The emitted fluorescence from analytes was collected by an Olympus 60×microscope objective (Tokyo, Japan), and passed through a Semrock bandpass filter (FF01-446/523/600/677-25) before reaching a R105UH photomultiplier tube (PMT) detector (Beijing Hamamatsu Photon Techniques, Beijing, China). The output signal was recorded and processed with a computer.
Sample preparation and derivatization with FITC
By dissolving 0.3814 g of Na2B4 stock solutions of SAs were prepared in methanol. These solutions were stored in the dark and were diluted as required to obtain the working standards. FITC as the fluorescence tag for SAs was dissolved in acetone and was stored in the dark at −20 ℃ before use. The running buffer was prepared Na2P4O7 · 10H2O in 100 mL of purified water, adjusted to pH 9.0 with 0.10 mol L‒1 NaOH solution or 0.10 mol L‒1 HCl solution.
One microliter (1.0 mmol L-1) SA working standard or sample and 2.0 μL FITC (10 mmol L‒1) were mixed in 10 mmol L‒1 sodium borate buffer solution (pH 9.0) solution in a 0.50-mL vial. The concentration of FITC solution added in the vial was 20 times higher than that of SAs in order to obtain complete and thorough reaction with fewer byproducts. The solution was kept in a 30 ℃ water bath in dark for 16 hr. The FITC-tagged sulfonamides (FITC-SAs) samples were kept in the dark at 4 ℃ before CE analysis. All solutions were filtered through 0.45-μm cellulose membrane filters (Heshi Technology Development Co., Ltd., Tianjin, China) before injecting into the separation capillary.
Sample extraction
One gram of chopped and homogenized chicken liver tissue was weighed into a 10-mL centrifuge tube; then 1.0 g anhydrous sodium sulfate and 5.0 mL acetonitrile were added. The mixture was homogenized for 1 min, vortexed for 30 sec, sonicated for 5 min, and centrifuged at 12000 rpm for 3 min. The supernatant was transferred to an empty and clean glass tube. The solid residues were submitted to an additional 5.0-mL acetonitrile extraction and the extracts were combined. Two milliliters isopropyl alcohol was added to the acetonitrile extract. Then organic extract was separated and evaporated by a rotary evaporator at 40 oC until dryness. Next, 1.0 mL ammonium acetate (10 mmol L‒1, containing 7% v/v acetonitrile) and 1.0 mL of acetonitrile saturated n-hexane were added to dissolve the residues. The solution was then transferred to a 5-mL centrifuge tube, and the sample was mixed in a vortex stirrer for 1 min and centrifuged at 12,000 rpm for 3 min. The upper layer (n-hexane) was discarded.
Another 1.0 mL n-hexane was added again. The procedures were repeated until the lower aqueous layer became transparent. To prepare the spiked chicken liver sample, six SAs of each 50 nmol L-1 were added to another 1.00 g chicken liver and the sample extraction was performed as in the above-mentioned procedures.
CE procedure
The new capillary was treated by flushing with 1.0 mol L‒1 NaOH for 30 min, 0.10 mol L‒1 NaOH for 10 min, and deionized water for 5 min sequentially before the first use. Between two consecutive injections, the capillary was rinsed with 0.10 mol L‒1 NaOH, deionized water, and running buffer for 3 min each, respectively. The running buffer was treated with ultrasonic degassing to avoid electric current interruption due to bubble formation. Sample injection was performed by siphon in take for 12 sec at a height of 20 cm. After the introduction of FITC-SA sample solution, 15 kV was applied across the capillary. All separations were performed on a 50.0 cm × 75 μm i.d. (365 μm o.d. and 48.0 cm effective length) uncoated fused-silica capillary with 10 mmol L‒1 sodium borate buffer solution (pH 9.0). All CE procedures were conducted at room temperature.
Results and discussion
Choice of LED and spectral filter
In order to obtain high excitation efficiency, the emission wavelength of LED should match the excitation wavelength of FITC derivatives. Therefore, the excitation wavelength of LED must be chosen carefully. Figure 2 depicts the fluorescence excitation and emission spectra of FITC-SAs monitored at emission 530 nm and excitation 499 nm, respectively. All FITC-SAs display strong fluorescence with excitation maxima at 499 nm and emission maxima at ca. 530 nm. The emission band of the LED overlaps with parts of the excitation spectra of the FITC-SAs (Figure 2). In general, LEDs possess broader spectral bandwidth, typically 25 nm full-width at half maximum. If an LED with maximum emission wavelength at 499 nm is used, it will overlap approximately 35% with the fluorescence emission of FITC-tagged SAs, resulting in high background and noise. Thus, both the excitation light from LED and fluorescence light from sample must be filtered.
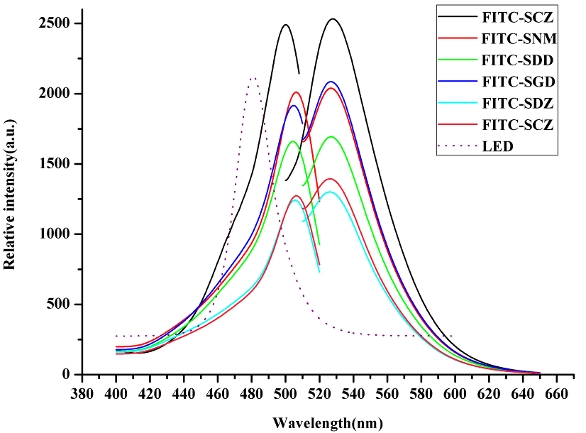 Figure 2 ‒ Fluorescence excitation and emission spectra of FITC-tagged sulfonamides. The emission band of the LED is also displayed.
The longer wavelength band of LED has to be removed so that only the fluorescence emission signal of the sample is allowed to reach the PMT. Considering these factors, a cyan LED with an emission maximum at 480 nm with a full-width at half-maximum of ~25 nm was used; there is only slight overlap with the fluorescence emission of FITC-SAs. Although the excitation efficiency at 480 nm is lower than that at 499 nm, higher detection sensitivity can still be obtained because of lower background and noise.
The choices of excitation filter and emission filter must match the emission wavelength of LED and FITC-SAs, and ensure minimal crosstalk between the filters and maximum fluorescent signal transmission. For these reasons, a 482-nm bandpass filter and another 523-nm bandpass filter were chosen as the excitation and emission filters, respectively.
Optimization of separation conditions
In order to improve the resolution of FITC-SAs, experimental conditions such as running buffer pH, running buffer concentration, and applied voltage were carefully examined.
Effect of running buffer pH
In CE separation, the pH of running buffer may affect not only the charges of analytes, but also the dissociation of capillary surface silanol groups with a concomitant effect on the resolutions of analytes. Experiments were performed using 10 mmol L‒1 sodium borate buffer at different pHs in the range 8.6−9.6. Figure 3 displays the effect of running buffer pH on the separation of FITC-SAs. When the pH is lower than 9.0, the resolution of FITC-SAs increases with the increase in pH. When the pH is higher than 9.0, the resolution decreases. As such, 9.0 was chosen as the optimal pH.
 Figure 3 ‒ Effect of pH of running buffer solution on the resolutions of FITC-sulfonamides. Sulfadimidine (SDD) and sulfamerazine (SMZ) pair (—■—), sulfamerazine (SMZ) and sulfadiazine (SDZ) pair (—●—), and sulfadiazine (SDZ) and sulfaclozine (SCZ) pair (—▲—).
Effect of running buffer concentration
Since the running buffer concentration can affect the CE separation of FTIC-SAs, a series of experiments were performed at the optimal pH of 9.0 to determine the optimum running buffer concentration. Increasing the concentration of the running buffer might increase the ionic strength, decrease the electroosmotic flow, and increase the migration time. At the same time, it might also result in excessive Joule heating that could ruin the resolution and repeatability.
Figure 4 displays the effect of running buffer concentration (5.0−20 mmol L‒1) on the separation of FITC-SAs. It was found that baseline separations of FITC-SAs were achieved at 10 mmol L‒1 sodium borate buffer. Therefore, 10 mmol L‒1 borate running buffer (pH 9.0) was selected and used for the subsequent experiments.
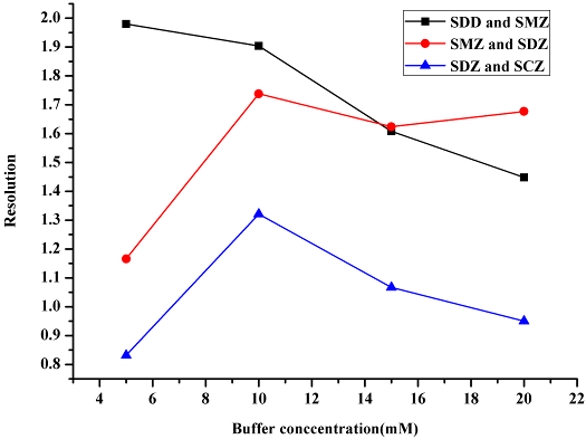 Figure 4 ‒ Effect of running buffer concentration on the resolutions of FITC-sulfonamides. Sulfadimidine (SDD) and sulfamerazine (SMZ) pair (—■—), sulfamerazine (SMZ) and sulfadiazine (SDZ) pair (—●—), and sulfadiazine (SDZ) and sulfaclozine (SCZ) pair (—▲—).
Effect of applied voltage
Besides the optimization of pH and concentration of the running buffer, the effect of applied voltage on CE separation of FTIC-SAs was investigated. Applied voltage can affect directly the migration time, resolution, and peak shape of analyte. Figure 5 depicts the effect of applied voltage on resolutions of FITC-SAs. The resolutions decrease with the increase in applied voltage. High voltage is advantageous to decrease the migration time but results in low resolution and excessive Joule heating that ruins the resolution and repeatability. As a result, 15 kV was chosen in this work since it produces good separation of FITC-SAs with reasonable migration times.
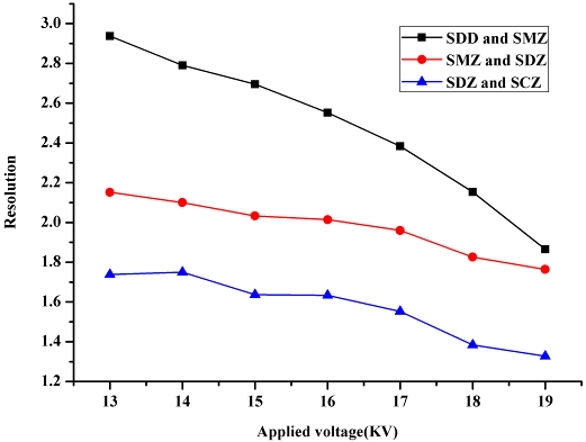 Figure 5 ‒ Effect of applied voltage on the resolutions of FITC-sulfonamides. Sulfadimidine (SDD) and sulfamerazine (SMZ) pair (—■—), sulfamerazine (SMZ) and sulfadiazine (SDZ) pair (—●—), and sulfadiazine (SDZ) and sulfaclozine (SCZ) pair (—▲—).
In essence, the optimal CE conditions for separation of FITC-SAs are 10 mmol L‒1 sodium borate buffer solution (pH 9.0), an applied voltage of 15 kV, and siphon injection for 12 sec at a height of 20 cm. Figure 6 displays the typical electropheretogram of a standard mixture of FITC-SAs. All six FITC-SAs are baseline separated with good peak shape and sensitivity.
 Figure 6 ‒ Typical electrophoretogram of a standard mixture of FITC-sulfonamides. The running buffer solution is 10 mmol L‒1 borate running buffer (pH 9.0) and the applied voltage is 15 kV.
System characteristics
In the present work, the CE-ICFO-LED-IFD method for the analysis of FITC-SAs was evaluated by determining its performance characteristics in terms of linearity, LOD, and repeatability of migration time and peak area. Table 1 summarizes the analytical figures of merit of the CE-ICFO-LED-IFD system. A series of FITC-SAs standard solutions were tested to determine the linearity between FITC-SAs concentration and detector signal. The linear ranges are 5.0−250 nmol L‒1 for SDD, SMZ, and SDZ; 10−500 nmol L‒1 for SGD and SCZ; and 10−1000 nmol L‒1 for SNM. The correlation coefficients are all better than 0.9990.
Table 1 ‒ Linear range, regression equation, correlation coefficient, limit of detection and relation standard deviation (RSD) of migration time and peak area for standard sulfonamides
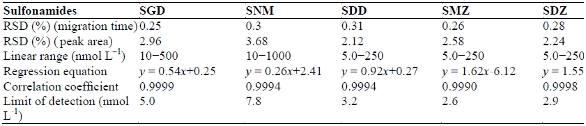
The LOD was determined at a signal-to-noise ratio of 3. The LODs are 5.0, 7.8, 3.2, 2.6, 2.9, and 6.6 nmol L‒1 for SGD, SNM, SDD, SMZ, SDZ, and SCZ, respectively. The repeatability of the method was investigated by analyzing FITC-SAs standards five times. The relative standard deviations (RSDs) of the FITC-SAs are better than 0.35% and 4.0 % for migration time and peak area (Table 1), respectively, suggesting that the proposed CE method presents good repeatability.
Sample analysis
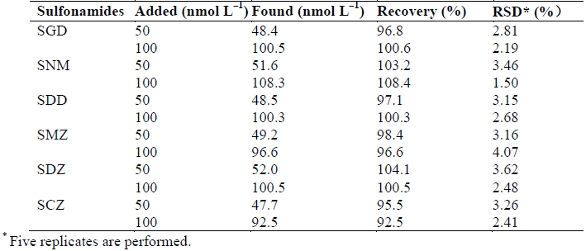
Finally, the proposed CE method was applied to determine SA residues in chicken liver. The samples were obtained from five healthy chickens from local supermarkets. They were all prepared and derivatized with FITC as described in the above sections. The samples were applied to CE-ICFO-LED-IFD under the optimal CE conditions. Figure 7a depicts the typical electrophoretogram of a chicken liver sample. No SA residues were detected in all the five chicken liver samples. Then spiked SA liver samples were analyzed by CE-ICFO-LED-IFD. Figure 7b displays the electrophoretogram of a spiked SA sample. All FTIC-SAs are well separated from the sample matrix and the excess FTIC. Table 2 summarizes the recoveries from chicken liver samples at two different SA spiking levels (50 and 100 nmol L‒1). The recoveries are satisfactory, ranging from 92.5 to 108.4 %.
 Figure 7‒ Typical electrophoretograms of (a) unspiked and (b) liver chicken samples spiked with 50 nmol L‒1 SNM, SCZ, SMZ, SGD, SDZ, and SDD derivatized by FITC. The running buffer is 10 mmol L‒1 sodium borate buffer (pH 9.0) and the applied voltage is 15 kV.
Table 2 ‒ Determination results of sulfonamides in chicken liver samples using the proposed CE-ICFO-LED-IFD system
Conclusion
A simple, sensitive, and reliable method for the determination of six commonly used SAs was presented. The CE separation of FITC-SAs can be completed by using a 10 mmol L‒1 borate running buffer (pH 9.0) within 9.0 min. The use of in-column optical fiber LED-induced fluorescence detector and bandpass filter enables the CE system to achieve lower background and LOD in comparison with traditional HPLC with UV detection. This study demonstrates applicability of the CE-ICFO-LED-IFD method for the determination of six SA residues in chicken liver. The method can be applied for routine quantitative evaluation of SA residues and offers the advantages of good sensitivity, simplicity, and reliability.
References
- Won, S.Y.; Lee, C.H. et al. Monitoring of 14 sulfonamide antibiotic residuess in marine products using HPLC-PDA and LC-MS/MS. Food Control 2011, 22(7), 1101‒7.
- Granja, R.H.M.M.; Lima, A.C.D. et al. Validation of a liquid chromatography with ultraviolet detection methodology for the determination of sulfonamides in bovine milk according to 2002/657/EC. Food Control 2012, 28(2), 304‒8.
- Furusawa, N.; Hanabusa, R. Cooking effects on sulfonamide residuess in chicken thigh muscle. Food Res. Int. 2002, 35(1), 37‒42.
- Sheridan, R.; Policastro, B. et al. Analysis and occurrence of 14 sulfonamide antibacterials and cloramphenicol in honey by solid-phase extraction followed by LC/MS/MS analysis. J. Agricul. and Food Chem. 2008, 56(10), 3509‒16.
- Huang, X.J.; Yuan, D.X. et al. Simple and rapid determination of sulfonamides in milk using ether-type column liquid chromatography. Talanta 2007, 72(4), 1298‒1301.
- Chung, H.-H.; Lee, J.-B. et al. Analysis of sulfonamide and quinolone antibiotic residuess in Korean milk using microbial assays and high performance liquid chromatography. Food Chem. 2009, 113(1), 297‒301.
- Littlefield, N.A.; Sheldon, W.G. et al. Chronic toxicity/carcinogenicity studies of sulphamethazine in Fischer 344/N rats: two-generation exposure. Food and Chem. Toxicol. 1990, 28(3), 157‒67.
- Doerge, D.R.; Decker, C.J. Inhibition of peroxidase-catalyzed reactions by arylamines: mechanism for the anti-thyroid action of sulfamethazine. Chem. Res. in Toxicol. 1994, 7(2), 164‒9.
- Commission of the European Communities (1991), Establishment by the European Community of Maximum Residues Limits (MRLs) for Residuess of Veterinary Medical Products in Foodstuffs of Animal Origin, The Rules Governing Medical Products in European Community VI, ECSC-EEC-EAEC, Brussels, Belgium, Oct 1991.
- Agarwal, V.K. High-performance liquid chromatographic methods for the determination of sulfonamides in tissue, milk and eggs. J. Chromatogr. A 1992, 624(1–2), 411‒23.
- Lin, C.-Y.; Huang, S.-D. Application of liquid–liquid–liquid microextraction and high-performance liquid-chromatography for the determination of sulfonamides in water. Anal. Chim. Acta 2008, 612(1), 37‒43.
- Malintan, N.T.; Mohd, M.A. Determination of sulfonamides in selected Malaysian swine wastewater by high-performance liquid chromatography. J. Chromatogr. A 2006, 1127(1–2), 154‒60.
- Tarbin, J.A.; Clarke, P. et al. Screening of sulphonamides in egg using gas chromatography– mass-selective detection and liquid chromatography–mass spectrometry. J. Chromatogr, B: Biomed. Sci. and Appl. 1999, 729(1–2), 127‒38.
- Hoff, R.B.; Barreto, F. et al. Use of capillary electrophoresis with laser-induced fluorescence detection to screen and liquid chromatography–tandem mass spectrometry to confirm sulfonamide residuesss: validation according to European Union 2002/657/EC. J. Chromatogr. A 2009, 1216(46), 8254‒61.
- Lara, F.J.; García-Campaña, A.M. et al. Determination of sulfonamide residues in water samples by in-line solid-phase extraction-capillary electrophoresis. J. Chromatogr. A 2009, 1216(15), 3372‒9.
- Fuh, M.-R.S.; Chu, S.-Y. Quantitative determination of sulfonamide in meat by solid-phase extraction and capillary electrophoresis. Anal. Chim. Acta 2003, 499(1–2), 215‒21.
- Hela, W.; Brandtner, M. et al. Determination of sulfonamides in animal tissues using cation exchange reversed phase sorbent for sample cleanup and HPLC–DAD for detection. Food Chem. 2003, 83(4), 601‒8.
- Soto-Chinchilla, J.J.; Gámiz-Gracia, L. et al. High performance liquid chromatography post-column chemiluminescence determination of sulfonamide residues in milk at low concentration levels using bis[4-nitro-2-(3,6,9-trioxadecyloxycarbonyl)phenyl] oxalate as chemiluminescent reagent. J. Chromatogr.A 2005, 1095(1–2), 60‒7.
- Yu, C.H.; Hu, B. C18-coated stir bar sorptive extraction combined with high performance liquid chromatography–electrospray tandem mass spectrometry for the analysis of sulfonamides in milk and milk powder. Talanta 2012, 90(0), 77‒84.
- Furusawa, N. Rapid high-performance liquid chromatographic determining technique of sulfamonomethoxine, sulfadimethoxine, and sulfaquinoxaline in eggs without use of organic solvents. Anal. Chim. Acta 2003, 481(2), 255‒9.
- Olefirowicz, T.M.;Ewing, A.G. Capillary electrophoresis in 2 and 5 .mu.m diameter capillaries: application to cytoplasmic analysis. Anal. Chem. 1990, 62(17), 1872‒6.
- Huang, X.-J.; Fang, Z.-L. Chemiluminescence detection in capillary electrophoresis. Anal. Chim. Acta 2000, 414(1–2), 1‒14.
- Lin, C.-E.; Cheng, H.-T. et al. Strategies for enantioseparations of catecholamines and structurally related compounds by capillary zone electrophoresis using sulfated β-cyclodextrins as chiral selectors. Electrophoresis 2006, 27(17), 3443‒51.
- Soga, T.; Heiger, D.N. Amino acid analysis by capillary electrophoresis electrospray ionization mass spectrometry. Anal. Chem. 2000, 72(6), 1236‒41.
- Pinto, D.M.; Arriaga, E.A. et al. Picomolar assay of native proteins by capillary electrophoresis precolumn labeling, submicellar separation, and laser-induced fluorescence detection. Anal. Chem. 1997, 69(15), 3015‒21.
- Klett, O.; Nischang, I. et al. Deviceless decoupled electrochemical detection of catecholamines in capillary electrophoresis using gold microband array electrodes. Electrophoresis 2002, 23(21), 3678‒82.
- Xiao, D.; Yan, L. et al. CE with LED-based detection: An update. Electrophoresis 2009, 30(1), 189‒202.
- Xiao, D.; Zhao, S.L. et al. CE detector based on light-emitting diodes. Electrophoresis 2007, 28(1‒2), 233‒42.
- Diao, P.Y.; Yuan, H.Y. et al. A simple and sensitive CE method for the simultaneous determination of catecholamines in urine with in-column optical fiber light-emitting diode-induced fluorescence detection. Talanta 2011, 85(3), 1279‒84.
Lihong Guo is the first author, and Prof. Dan Xiao is the corresponding author, College of Chemistry and College of Chemical Engineering, Sichuan University, Chengdu 610064, China; tel.: +86 28 85415029; fax: +86 28 85416029; e-mail: [email protected]. Martin M.F. Choi is Partner, State Key Laboratory of Environmental and Biological Analysis, and Department of Chemistry, Hong Kong Baptist University, Hong Kong SAR, China. Financial support from the National Natural Science Foundation of China (no. 21377089 and no. 21177090) is gratefully acknowledged. The authors declare that they have no conflict of interest. This article does not contain any studies with human or animal subjects.