Genetics, obesity, and lack of exercise play a vital role in the development of diabetes. Almost 80% of people with Type 2 diabetes are overweight. Both overweight and obesity are increasing in people with diabetes, but obesity is increasing at a much higher rate. Over the past 30 years, obesity has risen drastically across the nation and has become one of the most severe health conditions, impacting millions of United States citizens. It is estimated that 33% of U.S. adults aged 20 and over are overweight, 35.7% are obese, and 6.3% are extremely obese.1 Evidence from several studies indicates that obesity and weight gain are associated with an increased risk of diabetes2,3 via its role in the development of insulin resistance and its associated complications.4,5
It is widely believed that DNA is involved in complications arising out of obesity, diabetes, and other age-related diseases. Previous work by Z. Lila involved the detection of carboxymethyl-2’-deoxyadenosine (CMdA) and carboxymethyl-2’-deoxycytidine (CMdC)6‒8 from in vitro glycoxidation reactions, fasting urine specimens, calf thymus, and human serum DNA of diabetic persons. Estimation of CMdC and CMdA contents in fasting urine specimens using creatinine present therein as an internal standard indicate increasing amounts of CMdC and CMdA in human subjects within higher age groups compared to younger age groups of people investigated. These results are the first report of this kind involving DNA and glycoxidation reactions having implications in diabetes, mutations of DNA, and synthesis of important proteins such as insulin, energy transformation, cancer, etc.
An increased body mass index (BMI) among overweight individuals has been shown to be associated with increased risk of DNA damage due to oxidative stress9 and cardiovascular disease.10,11 8-oxodG is known to be a sensitive marker of oxidative DNA damage and of the total systemic oxidative stress in vivo.12 An increase in 8-oxodG content in urine in Type I and Type II (noninsulin-dependent) diabetic patients have been reported.13‒15
Glycoxidation and lipoperoxidation reactions incorporate permanent markers on biomolecules such as proteins. These markers serve as important diagnostic tools for evaluation and quantification of the extent of damage to the host molecules and the physiological consequences resulting from the inclusion of foreign materials in them. Important biomarkers of protein modification16‒18 of diabetes have been widely established and used. DNA biomarkers in relation to diabetes will continue to attract numerous technologies, methodologies, and procedures to provide better understanding of the disease.
Materials and methods
Study population
The study included 34 subjects (aged ≥18), both male and female, of whom 10 were healthy individuals, 10 were overweight, and 14 were nondiabetic obese. The informed consent form was obtained from each participant. The study protocol was approved by the Institutional Review Board of South Carolina State University and the Regional Medical Center in Orangeburg, SC. All participants were recruited through the Regional Medical Center.
Clinical measurements
Body weight and height was measured in light clothes and without shoes to the nearest 0.1 kg and 0.1 cm, respectively. Body mass index was calculated as the weight in kilograms divided by square of the height in meters. BMI was used as an index of obesity. Overweight is defined as a BMI of 25.0‒29.9 kg/m2 and obese is defined as a BMI ≥30.0 kg/m2.19
Biochemical measurements
Fasting blood and urine samples were collected from subjects. Blood samples were obtained for the measurements of glucose, lipids, and glycated hemoglobinA1c (HbA1c). Blood glucose level (BGL), lipids, and HbA1c were measured at the outpatient lab; BGL was assessed using fasting blood samples obtained through venipuncture. Serum glucose, total cholesterol (TC), triglycerides (TG), high-density lipoprotein cholesterol (HDL-c), and low density lipoprotein cholesterol (LDL-c) were analyzed using the enzymatic method. The HbA1c level was measured turbidimetrically. Fasting urine samples were obtained from volunteer donors and frozen at ‒20 oC until used. Urine creatinine concentration was estimated by a colorimetric method based on the Fisher Scientific Kit (Thermo Fisher Scientific, Waltham, MA) using the Pointe Scientific (Canton, MI) Creatinine Reagents and procedure.
Experimental procedure
All chemicals were obtained from Fisher Scientific (Pittsburgh, PA) unless otherwise indicated. All water was purified to a resistivity of 18.2 MΩ using the Milli-Q direct water purification system from Millipore Corp. (Molsheim, France).
1) Synthesis of CMdA using 2’-deoxyadenosine (dA) and chloroacetic acid: Synthesis of CMdA was achieved incubating 2’-deoxyadenosine (13 mg; 0.05 mmol) and chloroacetic acid (4.5 mg; 0.05 mmol). Isolation and identification of CMdA was carried out as described.6
2) Identification of CMdA in urine sample: In a typical experiment, 1 mL of fasting urine sample was adjusted to pH 7.0, evaporated in a rotary evaporator, and extracted three times with methanol; the residue was analyzed by HPLC (Figure 1b) and LC/MS/MS spectroscopy (Figure 2b).
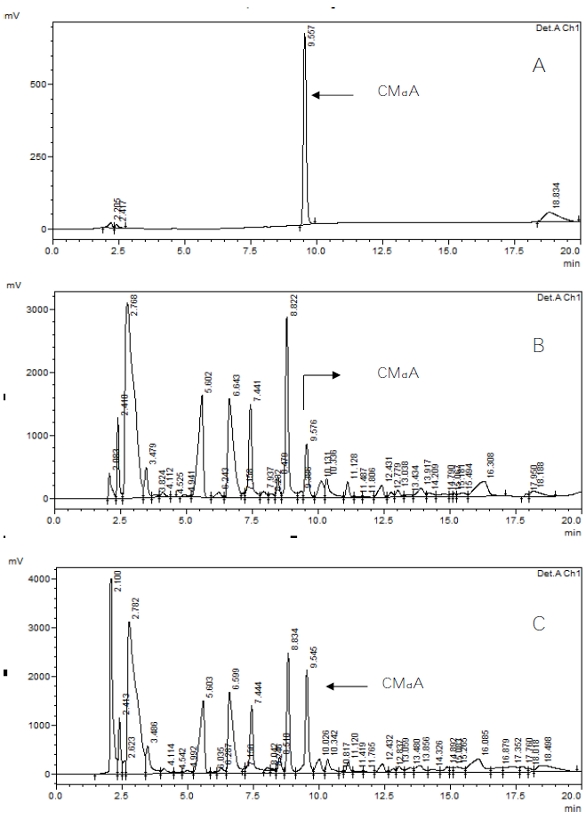 Figure 1 ‒ HPLC analysis of a) CMdA, b) fasting human urine sample, and c) mixing experiment of CMdA and fasting human urine sample.
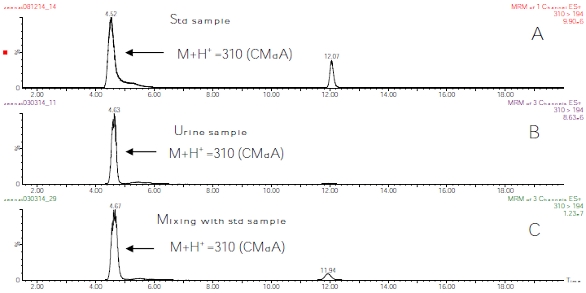 Figure 2 ‒ LC/MS spectrum using MRM spectrometric analysis of a) CMdA, b) CMdA in fasting human urine sample, and c) mixing experiment of CMdA and fasting human urine sample.
3) Estimation of CMdA in fasting human urine samples: The concentrations of CMdA analyzed by HPLC were expressed as ratios of urine creatinine concentrations.20,21 (Figure 3).
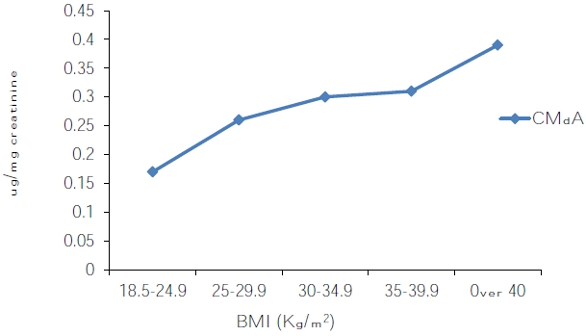 Figure 3 ‒ CMdA concentration by HPLC in fasting human urine samples expressed as a ratio of urine creatinine concentration by body mass index (BMI).
4) Hydrolysis of CMdA and detection of CMA: 1N HCl (1 mL) was added to CMdA at 27 oC for 24 hr. After 24 hr the sample was evaporated at 60 °C until dry using a rotary evaporator. Methanol (3 mL) was added to the dried residue; the mixture was sonicated, vortexed, and centrifuged; and the methanol fraction was collected. CMA was identified by HPLC (Figure 4a) and LC/MS electrospray spectroscopy (Figure 4b).
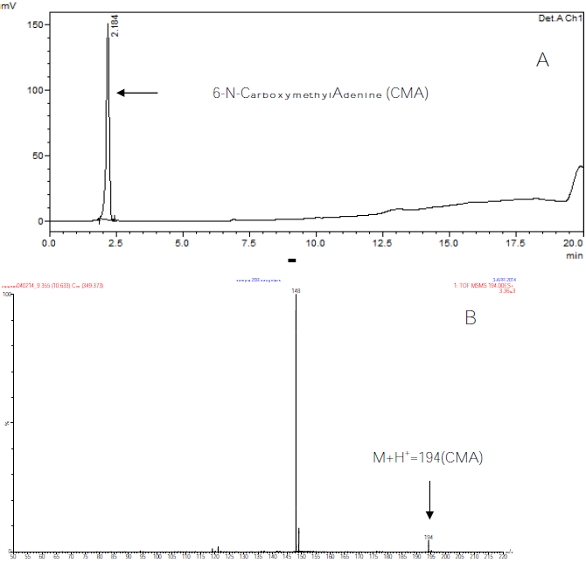 Figure 4 ‒ a) HPLC analysis of 1
M
HCL hydrolyzed CMdA and b) total ion chromatogram (TIC) and mass spectrum (electrospray MS/MS product ion scan) of carboxymethyladenine (CMA).5) Hydrolysis of human serum DNA to detect the presence of CMA: Human DNA (10 μg/μL) was hydrolyzed with 1N HCl at 27 oC for 24 hr. Methanol (3 mL) was added to the dried residue; the mixture was sonicated, vortexed, and centrifuged; and the methanol fraction was collected. The methanol extracted sample was then analyzed by HPLC and LC/MS using multiple reaction monitoring (MRM) mode (electrospray).
Instruments
The GENESIS 10S VIS UV/VIS spectrophotometer (Thermo Fisher Scientific) was employed for the quantitative determination of creatinine in fasting human urine samples using 40 mM picric acid as outlined in the Fisher Scientific procedure. The wavelength was set at 510 nm for the quantitation experiment.
Analysis by HPLC
The HPLC system (Shimadzu Corp., Columbia, MD) consisted of a low-pressure gradient pump (LC-20AT) with on-line degasser (DGU-20A5), autosampler (SIL-20AC), reversed-phase column (HYPERCARB 5 μm 150 × 4.6 mm), guard column (HYPERCARB 5 μm 10 × 4 mm) attached to the column head, column oven (CTO-20A), and system controller (CBM-20Alite). In addition, a UV/VIS detector (SPD-20AV) was employed at a wavelength of 254 nm.
Water/acetonitrile solvent mixture using gradient analysis was used for HPLC analysis. Solvent A was 100% water and solvent B was 100% acetonitrile. The flow rate was 1 mL/min.
Mass spectrometry analysis
LC/MS, triple quadrupole mass spectrometry (electrospray, MS/MS multiple reaction monitoring method) were used for detection and identification of the CMdA from synthetic and urine and blood sample specimens.
The LC column was a Neptune HILIC silica, 5 μm particles, 2.1 mm × 15 cm (ES Industries, West Berlin, NJ). The sample was dissolved in 85% acetonitrile/15% water. Samples were analyzed by LC/MS using hydrophilic interaction liquid chromatography (HILIC). Separation was performed using a binary solvent gradient as Solvent A: HPLC-grade water with 0.1% formic acid, and Solvent B: HPLC-grade acetonitrile with 0.1% formic acid.
Full scan mass spectral analysis was performed on a Micromass Qtof quadrupole time-of-flight mass spectrometer (Waters Corp., Milford, MA). LC/MS/MS was performed on a Waters Quattro Premier XE triple quadrupole mass spectrometer. The ionization method was positive ion electrospray.
Statistical analysis
Table 1 ‒ Comparison among control, overweight, and obese groups using ANOVA
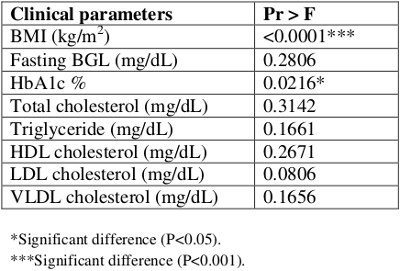
Data on clinical parameters for three groups used in the study were analyzed using the Statistical Analysis System (SAS, Cary, NC) software.22 The eight clinical parameters used were: body mass index (BMI), fasting blood glucose level (BGL), glycated hemoglobinA1c (HbA1c), total cholesterol (TC), triglycerides (TG), high-density lipoprotein cholesterol (HDL-c), low-density lipoprotein cholesterol (LDL-c), and very low-density lipoprotein cholesterol (VLDL-c). The subjects were divided into three groups: control, overweight, and obese. Descriptive statistical analyses were performed on all these clinical parameters to obtain descriptive statistics such as mean, median, and standard deviation (SD) as well as minimum and maximum values for all three groups.
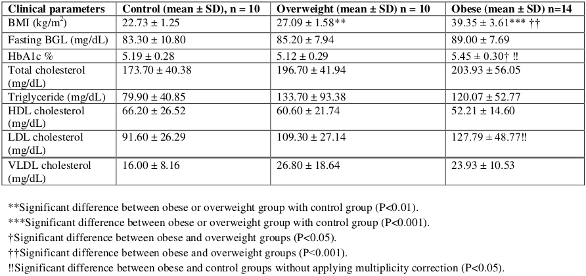
The General Linear Model (GLM) test was used to perform ANOVA to compare each clinical parameter among three groups followed by the Tukey’s test to compare each pair of groups. Results were tested at .05, .01, and .001 levels of significance. The results are shown in Tables 1 and 2 using mean ± SD and symbols *, †, and ‼ to indicate significant differences between different groups and at different levels of significance.
Table 2 ‒ Pairwise comparisons of control, overweight, and obese groups
Results
Table 1 provides the results of an overall ANOVA indicating the significant differences among three groups. The further pairwise comparisons of three groups on means of eight clinical parameters are provided in Table 2.
BMI was found to be significantly higher in the obese group (39.35 ± 3.61 kg/m2) when compared with the control group (22.73 ± 1.25 kg/m2; P<0.001). HbA1c showed a significant difference between the obese (5.45 ± 0.30) and overweight groups (5.12 ± 0.29; P <0.05). In addition, HbA1c showed a significant difference between the obese and control groups (5.19 ± 0.28; P <0.05) when multiplicity correction was not applied. No significant differences were observed in BGL, TG, TC, HDL-c, and VLDL-c values in pairwise comparisons of obese, overweight, and control groups. The level of LDL-c was found to be significantly higher in the obese group (127.79 ± 48.77 mg/dL) compared to the control group (91.60 ± 26.29 mg/d; P <0.05) when multiplicity correction was not applied.
The BGL level in the obese group (89.00 ± 7.69 mg/dL) was higher by 3.8 units than in the overweight group and by 5.7 units than in the control group; however, none of the differences was significant. The level of TC was found to be higher, but not significantly, in the obese group (203.93 ± 56.05 mg/dL) than in the overweight (196.70 ± 41.94 mg/dL) and control groups (173.70 ± 40.38 mg/dL). HDL-c was lower in both the overweight (60.60 ±21.74 mg/dL) and obese (52.21 ±14.60 mg/dL) groups than in the controls (66.20 ± 26.52 mg/dL). The level of TG was elevated in the overweight group (133.70 ± 93.38 mg/dL) than in the obese (120.07 ± 52.77 mg/dL) and control groups (79.90 ± 40.85 mg/dL), but no significant differences were found in the comparisons. Likewise, VLDL-c was slightly elevated in the overweight group than in the obese group and was lowest in the control group.
Detection of the presence of CMdA in fasting human urine samples was achieved by HPLC (Figure 1b) and LC/MS (Figure 2b) analysis of the methanol extracts of the neutral pH adjusted, dried samples. Mixing experiments with synthesized CMdA confirmed the identity of the CMdA present therein (Figure 1c and Figure 2c). The presence of the ion M+H+ 310 (CMdA) mass spectrometry confirmed the presence of CMdA in the samples examined. CMdA showed a molecular ion (M+H+ = 310) and a fragment at m/e 194, indicating breakdown of the parent ion into two groups at the N‒C bond between the heterocycle and the 2’-ribose part of the molecule (Figure 5).
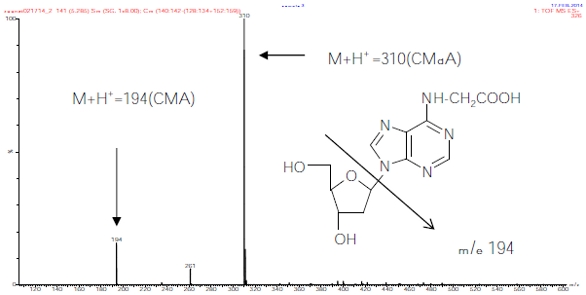 Figure 5 ‒ Total ion chromatogram (TIC) and mass spectrum of CMdA from synthesis.
CMdA was hydrolyzed to CMA using 1M HCL, and the sample was analyzed by HPLC (Figure 4a). The identity of CMA (M+H+ 194) was confirmed by electrospray MS/MS (Figure 4b). The presence of CMA in obese DNA is shown in Figure 6 by LC/MS mass spectrum using MRM mode analysis.
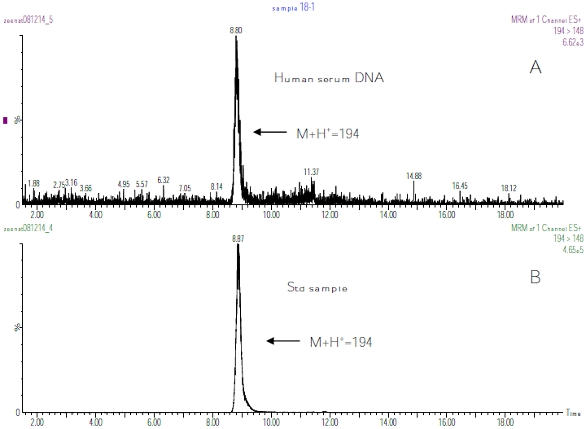 Figure 6 ‒ LC/MS spectrum using MRM method spectrometric analysis of 1
M
HCL hydrolyzed: a) human serum DNA and b) CMdA.Urine creatinine concentration was estimated by a colorimetric method based on the Fisher Scientific Kit using the Pointe Scientific Creatinine Reagents and procedure for each urine sample. The concentration of CMdA analyzed by HPLC was expressed as ratios of urine creatinine concentrations (Figure 3).
Discussion
Obesity contributes to a range of chronic diseases, including diabetes and hypertension. More than two-thirds (68%) of American adults are either overweight or obese.23 It is estimated that every 1 kg increase in weight is associated with a 9% relative increase in prevalence of diabetes.24
The eight clinical parameters used in this study were: BMI, fasting BGL, HbA1c, TC, TG, HDL, LDL, and VLDL. The results are shown in Tables 1 and 2 to indicate significant differences between control, overweight, and obese groups and at different levels of significance. BMI, BGL, HbA1c, TC, and TG were found to be higher in the obese group than in the overweight and control groups. HDL was lower in both the overweight and obese groups than in the control group. The level of LDL-c was found to be higher in the obese group compared with the control group (P <0.05). Lipid peroxidation acts principally on LDL. In this study, a statistically significant difference in LDL between the obese and control group was found.
CMdA compound was, for the first time, detected from fasting urine specimens and serum DNA of obese persons identified by HPLC, LC/MS, and triple quadrupole mass spectrometry (MS/MS) (Figures 1, 2, and 4). The mixing experiment with synthesized CMdA and fasting human urine sample clearly identified CMdA by HPLC and LC/MS electrospray spectroscopy. To confirm the presence of CMdA in obese DNA, the DNA was hydrolyzed with 1M HCL. The product CMA was identified by LC/MS with a molecular ion M+H+ 194.
The presence of CMdA in obese human subjects has not been reported thus far. It was previously reported that CMdA is present in fasting urine samples from nondiabetic obese persons.25 This study showed a relationship between urinary CMdA and BMI in obese persons. The CMdA level was found to be higher in obese persons compared with normal weight persons (Figure 3). This finding may explain the strong correlation between the significant rise in oxidative DNA damage and the role of obesity in increasing the risk of diabetes. These results indicate that CMdA can be used as an indicator to assess the extent of oxidative stress in obese persons and may be a useful indicator to the onset of diabetes in obese persons.
References
- National Center for Health Statistics, United States, 2007, with chart book on Trends in the Health of Americans. Hyattsville, MD. U.S. Department of Health and Human Services, Centers for Disease Control and Prevention.
- Ford, E.S.; Williamson, D.F. et al. Weight change and diabetes incidence: findings from a national cohort of US adults. Am. J. Epidemiol. 1997, 146, 214‒22.
- Resnick, H.E.; Valsania, P. et al. Relation of weight gain and weight loss on subsequent diabetes risk in overweight adults. J. Epidemiol. Community Health 2000, 54, 596‒602.
- Kaplan, N.M. The deadly quartet: upper-body obesity, glucose intolerance, hypertriglyceridemia, and hypertension. Arch. Intern Med. 1989, 149(7), 1514–20.
- Maheux, P.; Jeppesen, J. et al. Additive effects of obesity, hypertension, and type 2 diabetes on insulin resistance. Hypertension 1994, 24695–8.
- Lila, Z.A.; Allen, P. et al. https://www.americanlaboratory.com/913-Technical-Articles/18626-Modifications-of-DNA-in-Relation-to-Diabetes-Identification-of-Carboxymethyl-2-Deoxyadenosine-From-Glycoxidation-Reactions-Calf-Thymus-DNA-Human-Urine-and-DNA/.
- Lila, Z.A.; Manzano, K. et al. https://www.americanlaboratory.com/913-Technical-Articles/122551-Modification-of-DNA-in-Relation-to-Diabetes-Identification-of-CMdC-From-Glycoxidation-Reactions-and-Estimation-of-CMdC-and-CMdA-in-Fasting-Human-Urine/.
- Lila, Z.A.; Manzano, K. et al. Glycoxidative Modification of DNA (dC) and RNA (C) in Relation to Diabetes: Estimation of Carboxymethyl-2’-Deoxyadenosine (CMdA) and Carboxymethyl-2’-Deoxycytidine (CMdC) in Fasting Human Urine. Proceedings of the Network of Minority Research Investigators, 10th annual workshop held April 19‒20, 2012, Bethesda, MD.
- Hofer, T.; Karlsson, H.L. et al. DNA oxidative damage and strand breaks in young healthy individuals: a gender difference and the role of life style factors. Free Radic. Res. 2006, 40, 707‒14.
- Wannamethee, S.; Shaper, A. et al. Overweight and obesity and the burden of disease and disability in elderly man. Int. J. Obes. 2004, 28, 1374‒82.
- Auer, R.; Lau, D. et al. Obesity in Canadian children. CMAJ 2001, 164, 1563‒5.
- Ha, H.; Kim, C. et al. DNA damage in the kidneys of diabetic rats exhibiting microalbuminuria. Free Radic. Biol Med. 1994, 16, 271–4.
- Dandona, P.; Thusu, K. et al. Oxidative damage to DNA in diabetes mellitus. Lancet 1996, 347, 444–5.
- Leinonen, J.; Lehtimaki, T. et al. New biomarker evidence of oxidative DNA damage in patients with non-insulin-dependent diabetes mellitus. FEBS. Lett. 1997, 417, 150–2.
- Hinokio, Y.; Suzuki, S. et al. Oxidative DNA damage in diabetes mellitus: its association with diabetic complications. Diabetologia 1999, 42, 995–8.
- Ahmed, M.U.; Thorpe, S.R. et al. Identification of NE-carboxymethyllysine as a degradation product of fructoselysine in glycated proteins. J. Biol. Chem. 1986, 261, 4889‒94.
- Januszewski, A.S.; Alderson, N.L. et al. Role of lipids in chemical modification of proteins and development of complications in diabetes. Biochem. Soc. Trans. 2003, 31, 1413–16.
- Rodríguez-García, J.; Requena, J.R. et al. Increased concentrations of serum pentosidine in rheumatoid arthritis. Clin. Chem. 1998, 44(2), 250‒5.
- World Health Organization. Diet, nutrition and the prevention of chronic diseases. World Health Organ Tech Rep Ser. 2003, 916, 1‒149.
- Kumar, A.K.; Ramachandran, G. et al. Can urine lamivudine be used to monitor antiretroviral treatment adherence? MedGenMed. 2006, 8(4), 53.
- Barr, D.B.; Wilder, L.C. et al. Urinary creatinine concentrations in U.S. population: implications for urinary biologic monitoring measurements. Environ. Health Perspect. 2005, 113(2), 192‒200.
- SAS for Windows. Version 9.2 SAS Institute Inc., Cary, NC, 2008.
- Flegal, K.M.; Carroll, M.D. et al. Prevalence and trends in obesity among U.S. adults, 1999‒2008. JAMA 2010, 303(3), 235‒41.
- Mokdad, A.; Ford, E. et al. Diabetes trends in the US: 1990‒1998. Diabetes Care 2000, 23, 1278‒1.
- Lila, Z.A.; Flowers, D. et al. Modification of DNA (dA) and RNA (A) in Relation to Diabetes and Obesity: Detection of Carboxymethyl-2’-Deoxyadenosine (CMdA) and Carboxymethyl-Adenosine (CMAd) in Diabetic and Obese Urine. Proceedings of the Network of Minority Research Investigators, 12th Annual Workshop held April 14‒15, 2014, Bethesda, MD.
Zeenat Ara Lila, Ph.D., is Research Scientist, 1890 Research Department, South Carolina State University, 300 College St., Orangeburg, SC 29117, U.S.A.; tel.: 803-533-3925; fax: 803-533- 3792; e-mail: [email protected]. Dawnn Flowers and Morgan Tubman Jackson are with the Department of Biological and Physical Sciences, South Carolina State University. The authors acknowledge the following: 1890 Evans-Allen Research Program, South Carolina State University; Dr. Louis D. Whitesides, 1890 Research Administrator, South Carolina State University; Dr. William E. Cotham, Associate Director, Mass Spectrometry Laboratory, USC, Columbia, SC; Dr. Brian Kendall, Medical Director, Hospitalist Services, the Regional Medical Center, Orangeburg, SC; Mr. Gary Ferguson, Director, Department of Pathology and Laboratory Medicine, the Regional Medical Center, Orangeburg, SC; and Mr. Erik Simensen, Program Director, Institute of Public Health Research and Outreach, Orangeburg, SC.