Quality control (QC) is becoming increasingly important in nucleic acid-based testing.1–4 As detection technologies become more and more sensitive, final results are influenced not only by biological variability—caused by differences in samples or sample types—but they may also be influenced by technical variability, that is, any differences introduced during sample processing until the final scientific data are generated. The more processing steps a molecular biology application comprises, the higher the risk of introducing such technical variability and thus also the risk to generate incorrect, false positive, or false negative results.
Careful consideration of all steps along molecular biology workflows and implementation of QC procedures at appropriate breakpoints reduce the chance that samples that do not meet the quality requirements of downstream steps are carried through the entire process. By establishing such strategies, laboratories can improve the level of standardization, reduce the risk of repeat experiments, and utilize operator time more efficiently. Moreover, considering the total costs of applying cutting-edge detection technologies, such an approach can lead to significant savings and ensure tighter budget control.
QC parameters: purity and concentration
Nucleic acid QC usually includes quantitative and qualitative aspects. Parameters monitored typically include:
- Nucleic acid concentration
- Detection of chemical contaminants and other impurities
- Nucleic acid integrity.
Nucleic acid quantification is essential to obtain accurate and reliable results in many molecular biology assays such as PCR (polymerase chain reaction) and real-time PCR reactions.5 Low amounts of template can lead to insufficient amplification and lack of yields, and therefore bear the risk of false negative results. On the other hand, access template can result in unspecific amplification, but may also impact polymerase activity due to insufficient denaturation or transfer of inhibitors. The most common inhibitors are either chemical compounds used during the nucleic acid purification procedure—such as chaotropic salts, phenol, or ethanol—or residual impurities derived from the original sample material, i.e., hemoglobin, heparin, immunoglobulins, and other proteins.
Nucleic acid quantification methods
Nucleic acid concentration can be assessed using four different methods: absorbance measurement (optical density), agarose gel electrophoresis, fluorescence spectroscopy using fluorescent DNA-binding dyes, or microfluidics-based/capillary electrophoresis (CE) systems (Table 1). The two most commonly used methods are UV/VIS spectrophotometry and fluorescence spectroscopy.
While fluorescence-based methods are characterized by a high sensitivity down to pg/mL levels, they require additional upfront handling steps such as incubation of samples with appropriate fluorescent dyes, as well as creation of standard curves using known quantities of nucleic acid. Moreover, these methods do not necessarily provide information on potential impurities present in samples, which may affect subsequent downstream steps.
UV/VIS spectrophotometry
UV/VIS spectrophotometric determination of nucleic acid concentration is probably the easiest method to perform and has been implemented as a standard operating procedure in many laboratories. This method is based on the fact that the heterocyclic rings of nucleotides absorb UV light with an absorption maximum at around 260 nm. Applying the Lambert-Beer Law allows relating the amount of light absorbed to the concentration of the measured analyte. In addition, examination of sample spectra permits detection of potential impurities.
Table 1 – Nucleic acid quality control parameters and assessment technologies
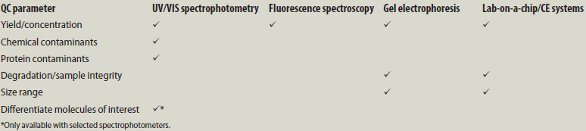
Many chemical compounds have characteristic absorbance profiles with maxima at low wavelengths between 220 nm and 230 nm, whereas proteins typically show an absorption maximum at 280 nm resulting from the aromatic amino acids. Therefore, A260/280 ratios and A260/230 ratios are frequently calculated and used as a measure of nucleic acids purity. A260/280 ratios of ~1.8 and ~2.0 are generally accepted as indicators for “pure” DNA and RNA, respectively; expected A260/230 values are commonly in the range of 2.0–2.2.
 Figure 1 – QIAxpert System for high-speed quantification and quality control of nucleic acids.
However, a number of factors should be considered by researchers when using UV/VIS spectrophotometry to assess nucleic acid quantity and quality. Firstly, the indicated absorbance ratios provide an ambiguous metric, since it has been shown that significant deviations may occur as a result of the specific extraction method applied, changes in pH, and/or salt concentration.6 Secondly, a number of potential contaminants such as phenol, phenol-containing reagents, or guanidine-isothiocyanate contribute significantly to the absorption at 260 nm, and may cause overestimation of nucleic acid concentration. Finally, conventional absorbance measurement is not able to discriminate between nucleic acid types—dsDNA vs ssDNA vs RNA—which may also result in overquantification of the analyte of interest, since all nucleotides present in a sample absorb at 260 nm.
 Figure 2 – a) Linearity of nucleic acid quantification: Salmon sperm DNA (10 mg/mL) (Life Technologies, Carlsbad, CA) was used to generate a dilution series ranging between 2000 and 2 ng/μL. Five replicates of each sample were measured on the QIAxpert System and data points are plotted against the target concentration. b) High reproducibility of measurements. Dilution series of salmon sperm DNA (Life Technologies); five replicates of each sample were measured on the QIAxpert System. Reproducibility was assessed by calculating the coefficient of variation.
Next-generation UV/VIS spectrophotometers such as the QIAxpert System (QIAGEN GmbH, Hilden, Germany) overcome these challenges by providing advanced software solutions enabling differentiation between molecules of interest.
Differentiation between molecules of interest
The QIAxpert System (Figure 1) is a high-speed UV/VIS spectrophotometer for accelerated DNA and RNA quantification and quality control. The system is operated through an integrated touchscreen and uses disposable microfluidic slides for analyzing up to 16 samples per run; processing time is less than 90 sec for a fully loaded slide. If not all positions on a slide have been used, empty wells can be taken advantage of at a later point in time to ensure maximum cost efficiency. Only 2 μL of sample is required to be loaded per well and the capillary channels preserve the samples after loading and prevent evaporation. Therefore, samples can be left at room temperature for up to 2 hr prior to readout without any impact on final results.
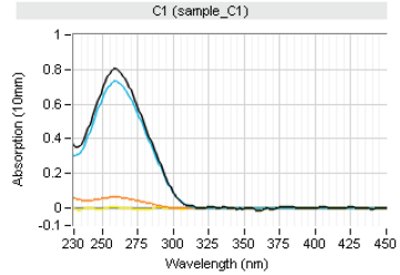 Figure 3 – Typical view generated by spectral content profiling protocols. Total RNA was purified from Jurkat cell using RNeasy Mini technology (QIAGEN). Pure total genomic DNA (Promega, Madison, WI) was spiked into the eluate to a final level of 10% and measured on the QIAxpert System. Dark blue curve: total measured UV/VIS sample spectrum. Light blue curve: profile of RNA isolated by the software algorithms. Orange curve: profile of residual impurities found.
The microfluidic disposables are constructed with high uniformity and using special plastics that allow high optical transmission over the full UV/ VIS spectrum to ensure accurate and reproducible nucleic acid quantitation (Figure 2a). The system covers a large dynamic range from 0.03 OD up to 40 OD (corrected to 1 cm pathlength) and shows excellent linearity of the entire spread (Figure 2b).
Moreover, unique spectral content profiling protocols enable discriminating between molecules of interest. Lambert-Beer Law also applies to mixtures of noninteracting components: If individual solutions of substances produce, at the same wavelength, specific absorbances, respectively, the total absorbance of a mixture of those substances would produce, at the same wavelength, an absorbance equal to the sum of the single measured values. In a reverse effort, it is therefore possible to decompose a measured spectrum into the spectra of the individual components the mixture consists of, provided corresponding reference profiles of possible constituents are known.
The QIAxpert System software applies state-of-the-art software algorithms that break down the overall measured UV/VIS spectrum and permit accurate determination of the contribution of the molecule of interest to the measured profile versus that of impurities and sample turbidity (Figure 3). This feature allows researchers to combine nucleic acid quantitation with the detection of residual genomic DNA in RNA samples and vice versa, in an easy-to-perform and fast one-step approach. Corrective actions can be taken if needed, that may be critical, for example, when performing real-time PCR (RT-PCR),7,8 where residual gDNA contamination can lead to amplification of both cDNA and gDNA sequences, resulting in false positive real-time PCR signals with lower CT values than true positives.
Summary
Novel UV/VIS spectrophotometers such as the QIAxpert System allow for fast and accurate nucleic acid quantification, while eliminating the need for repetitive drop-and-clean actions, thus minimizing the risk of cross-contamination and streamlining the work flow in the lab. In addition, unique spectral protocols allow discriminating between molecules of interest and provide researchers with a more comprehensive understanding of sample quality and composition that allows them to make better-informed decisions with regard to usage of samples in subsequent downstream processes.
References
- Raggi, C.C.; Pinzani, P. et al. External quality assurance program for PCR amplification of genomic DNA: an Italian experience. Clin. Chem. 2003, 49(5), 782–91.
- Bustin, S.A.; Benes V. et al. The MIQE Guidelines: minimum information for publication of quantitative real-time PCR experiments. Clin. Chem. 2009, 55(4), 611–22.
- Wahlberg, K.; Huggett, J. et al. Quality assessment of biobanked nucleic acid extracts for downstream molecular analysis. Biopreservation and Biobanking 2012, 10(3), 266–75.
- Simbolo, M.; Gottardi, M. et al. DNA Qualification workflow for next generation sequencing of histopathological samples. PLoS ONE 2013, 8(6), e62692.
- Bustin, S.A. Expert Guides—Definitive qPCR, Nucleic Acid Quality Control, 2012; ISBN 978-0-9572024-2-9.
- Wilfinger, W.W.; Mackey, K. et al. Effect of pH and ionic strength on the spectrophotometric assessment of nucleic acid purity. Biotechniques 1997, 22, 474–6, 478–81.
- Fleige, S.; Pfaffl, M. RNA integrity and the effect on the real-time qRTPCR performance. Molecular Aspects of Medicine 2006, 27, 126–39.
- Laurell, H.; Iacovoni, J.S. et al. Correction of RT–qPCR data for genomic DNA-derived signals with ValidPrime. Nucl. Acids Res. 2013; doi:10.1093/nar/gkr1259.
Dr. Carola Schade is Director, Head of Instruments Business, Life Sciences, QIAGEN GmbH, Qiagen Strasse 1, 40724 Hilden, Germany; tel.: +49 2103 290; e-mail: [email protected] ; www.qiagen.com