Suppose one has never seen an automobile and is asked to perform the simple task—while blindfolded—of adding gasoline to the car and checking its oil. A task like this is impossible to perform until the blindfold is removed and one sees the structure (the car) in detail. Similarly, biomedical scientists seek to uncover the three-dimensional (3-D) structures of molecular complexes, which are responsible for most biological activities within cells.1–4 When researchers see the 3-D structures of molecular complexes and identify interactions among their subunits, they begin to appreciate how these complexes normally function and how they malfunction in human diseases.
Rational drug design relies on 3-D structures at atomic resolution to decipher functional mechanisms of biological complexes and design preventive and therapeutic approaches against their malfunctions. Until now, atomic structures have been primarily determined by X-ray crystallography and nuclear magnetic resonance (NMR) spectroscopy. However, with rare exception—well behaved, these two methods both work only for small objects like individual proteins. X-ray crystallography requires (often difficult) crystallization, and for larger structures, it is generally applied only to pieces; NMR works only for molecules with molecular weight of <50 kiloDaltons
Since the demonstration of flash-freezing as an effective means to preserve molecules in their frozen hydrated state by Dubochet and colleagues,5 cryo electron microscopy (cryoEM) images of molecular complexes preserved in their “native,” noncrystalline state are often used for 3-D reconstruction.6 Automation in cryoEM has allowed for the recording and processing of tens of thousands of images, leading to the visualization of molecular interactions at near-atomic (3–4)7,8 and atomic resolution.9 As detailed below, sample preparation in cryoEM is simple and is now largely automated. As such, cryoEM is capable of dealing with difficult, large, and transiently stable complexes—those that are unsuitable to X-ray crystallography and NMR.
Experimental
High-resolution cryoEM requires careful consideration of a number of factors, including: 1) proper sample preparation to ensure structural homogeneity; 2) a well-aligned electron microscope to acquire high-resolution cryoEM images; 3) accurate determination of image parameters to correct for contrast transfer function; 4) efficient refinement and computation to obtain a 3-D density map; and, finally, 5) appropriate choices of modeling tools to build atomic models for functional interpretation. The following experimental steps address these factors.
Sample preparation
Biological samples are prepared using standard purification protocols specific to each sample type of interest and stored in physiological buffer. An aliquot (1–3 μL) of the sample is applied to an EM grid using a pipet, blotted using filter paper to remove excess sample, and plunged into liquid ethane cooled by liquid nitrogen. This process of sample preparation can be carried out either manually using a simple plunger (Figure 1a) or automatically using commercially available machines such as an FEI Vitrobot (Hillsboro, OR) (Figure 1b). The frozen hydrated sample is transferred into a microscope column that is maintained at liquid nitrogen temperature (77 K).
 Figure 1 – Work flow of cryoEM by manual operations (a) and by automatic instruments or software (b). With automation, frozen hydrated samples are obtained in a Vitrobot with computer control, and then loaded into an instrument called the Titan Krios (FEI) through a sample autoloader. Data acquisition is carried out and monitored either locally or remotely by a computer program such as Leginon.10
Imaging
Electrons emitted from the electron gun are condensed into a parallel, coherent beam that penetrates the sample loaded in the column. The electron waves exited from the sample are expanded through a set of lenses to produce a magnified (~100,000×) projection image on an electron detector, such as a direct-electron detecting device (DDD) or a more conventional charged-coupled device (CCD). Produced by counting electrons with quantum efficiency, DDD images have significantly improved contrast and image resolution over CCD images. This process is executed entirely either on a local or on a remote computer monitor through a program such as the EPU commercial package (Figure 1b) from FEI or the free software Leginon.10
The most important resolution-limiting factor in the cryoEM of biological samples is sample damage caused by bombardment of electrons which, if exceeding 20 electrons/Å2, could break the chemical bonds and cause damage to the sample structures. To handle this limitation, computer programs are designed to keep the number of electrons used for identifying the sample area of interest to a minimum to reduce electron-induced sample damage.
Hierarchical, multilevel imaging (Figure 2a–d) for sample identification and targeting minimizes the electrons used for tracking target sample areas and for setting up focus condition. Focusing is done by using areas adjacent to the sample area of interest. Consequently, most of the allowable electron dose (~20 electrons/Å2) is used to obtain the final cryoEM image for 3-D reconstruction (Figure 2e).
 Figure 2 – Strategy to minimize electron damage to biological samples in cryoEM. With Leginon,10 sample areas of interest are identified and targeted through multiple hierarchical levels, from the cryoEM sample grid (a), grid regions (b), grid square (c), holes (d) to the final cryoEM image (e) recorded with the total accumulated electron dose of ~20 electrons/Å2 from steps a to e. The sample shown here is dengue virus, an enveloped virus.
Image correction, 3-D reconstruction, and atomic modeling
To obtain a 3-D structure from cryoEM projection images, particles are boxed out (bottom left of Figure 3) and their orientations are determined by image processing. Tens to hundreds of thousands of particles are corrected for artifacts and are merged either by Fourier synthesis or by back-projection for 3-D reconstruction. 3-D structure is improved gradually from 30 Å to ~3 Å resolution in an iterative and computation-intensive orientation refinement process based on comparisons of particle images and computed projections of the 3-D reconstruction (Figure 3). Atomic models are built into the 3-D reconstruction by tracing protein backbone and matching amino acid side chains with tools such as Coot.
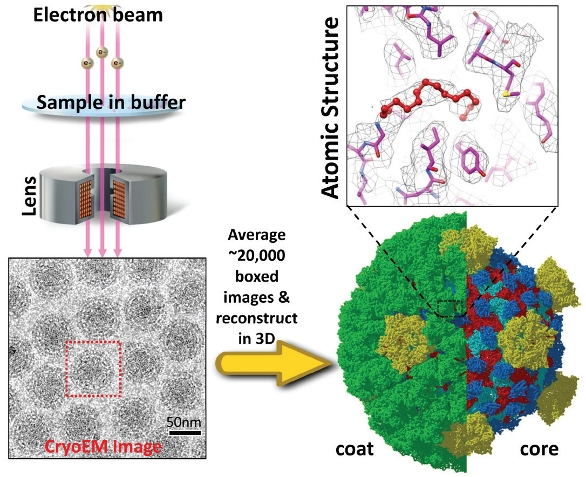 Figure 3 – 3-D computational reconstruction and atomic modeling in cryoEM. Illustration on left shows the formation of projection images of aqua-reovirus intermediate subviral particles (ISVP) obtained by cryoEM.11 Thousands of cryoEM images of ISVP are recorded automatically, processed by powerful computer clusters to determine the orientation and center parameters, and combined to generate a 3-D reconstruction. The 3-D reconstruction can then be displayed in colors (lower right), used to derive atomic models (upper right) of the molecules and reveal molecular interactions.
Results
Automation in both image acquisition and processing has significantly reduced the required amount of sample to about 1–3 μg, and the required data processing time for 3-D structure determination to only one or just a few days (depending on the quality of images and computational power). A single cryoEM grid contains tens of thousands of holes, each with a suspended ice layer containing many particles (Figure 2). If all imaged, the areas within these holes could yield sufficient particle images for determining a 3-D structure to atomic resolution.
Figure 3 shows the cryoEM images and 3-D construction of the transiently stable intermediate subviral particles (ISVP) and an atomic model of the membrane penetration protein VP5 trimer.11 The structure was determined to 3.3 Å resolution, permitting segmentation of individual protein molecules (shown in different colors in the right lower panel) and identification of side chains of amino acid residues in the 3-D map. An atomic model was then built by tracing the backbone of proteins and by identifying matching side chain densities to build an atomic model of the full virus particle. In the zoom-in view of the atomic structure of VP5, an N-terminal myristoyl group, a “fusion finger” (red), was clearly resolved. This fusion finger is buried in a hydrophobic pocket of VP5, and thus is not yet engaged in receptor binding and host–membrane insertion (upper right panel).
In general, once a 3-D reconstruction is obtained, researchers can examine the particle’s molecular components to identify their interactions and understand its mode of operation. Such information can be used for designing counterstrategies for intervention. For example, if the object of interest is a multicomponent enzyme, the interactions at its active sites can be identified to study its mechanism of catalysis. In the case of an object involved in a disease, molecular interactions can provide clues about the pathogenesis of the disease and inform efforts for countermeasures.
Conclusion
Since the construction of the first electron microscope in 1932 by Ernst Ruska and Max Knoll, electron microscopes have long been the tool of choice to produce two-dimensional micrographs in subcellular studies and biopsy diagnostics. CryoEM and automation have ushered them into the arsenal of structural biology, alongside the conventional techniques of X-ray crystallography and NMR, as a major tool (and sometimes the preferred tool) for studies of molecular interactions in supramolecular assemblies or machines. CryoEM is particularly favorable for large and transiently stable complexes for which conventional determination methods are unsuitable. CryoEM has thus come of age for wide application in both basic biomedical research in academia and structure-based drug design in industry.
References
- Alushin, G.M.; Ramey V.H. et al. The Ndc80 kinetochore complex forms oligomeric arrays along microtubules. Nature 2010, 467, 805–10.
- Park, E.; Menetret, J.F. et al. Structures of the SecY channel during initiation of protein translocation. Nature 2013; doi:10.1038/nature12720.
- Fotin, A.; Cheng, Y. et al. Molecular model for a complete clathrin lattice from electron cryomicroscopy. Nature 2004, 432, 573–9.
- Peng, L.; Ryazantsev, S. et al. Three-dimensional visualization of gammaherpesvirus life cycle in host cells by electron tomography. Structure 2010, 18, 47–58.
- Adrian, M.; Dubochet, J. et al. Cryo-electron microscopy of viruses. Nature 1984, 308, 32–6.
- Frank, J. Single-particle reconstruction of biological macromolecules in electron microscopy—30 years. Q. Rev. Biophys. 2009, 42, 139–58.
- Grigorieff, N.; Harrison, S.C. Near-atomic resolution reconstructions of icosahedral viruses from electron cryo-microscopy. Curr. Opin. Struct. Biol. 2011, 21, 265–73.
- Yu, X.; Jin, L. et al. 3.88 Å structure of cytoplasmic polyhedrosis virus by cryo-electron microscopy. Nature 2008, 453, 415–9.
- Zhou, Z.H. Atomic resolution cryo electron microscopy of macromolecular complexes. Adv. Protein Chem. Struct. Biol. 2011, 82, 1–35.
- Carragher, B.; Kisseberth, N. et al. Leginon: an automated system for acquisition of images from vitreous ice specimens. J. Struct. Biol. 2000, 132, 33–45.
- Zhang, X.; Jin, L. et al. 3.3 Å cryo-EM structure of a nonenveloped virus reveals a priming mechanism for cell entry. Cell 2010, 141, 472–82.
Laurie J. Wang is with the Department of Microbiology, Immunology and Molecular Genetics, and Z.H. Zhou, Ph.D., is Director of the Electron Imaging Center for Nanomachines, California NanoSystems Institute, University of California, Los Angeles (UCLA), Los Angeles, CA 90095-7364, U.S.A.; tel.: 310-983-1033; e-mail: [email protected].