Thermal analysis includes techniques in which a physical property of a substance is measured as a function of temperature and time while the substance is subjected to a controlled temperature program in a specified atmosphere. Thermal analysis techniques such as thermogravimetry analysis (TGA), differential scanning calorimetry (DSC), and mechanical testing (thermomechanical analysis [TMA] and dynamic mechanical analysis [DMA]) can provide insight into a material’s intrinsic properties, processing conditions and history, storage, and stability.1 Thermal analysis techniques can be used in an investigative manner along with other analytical techniques (microscopy, spectroscopy, and chromatography) to build a comprehensive study of the mode and cause of plastics failure (see Table 1).2
Table 1 – Thermal techniques used in the failure analysis process
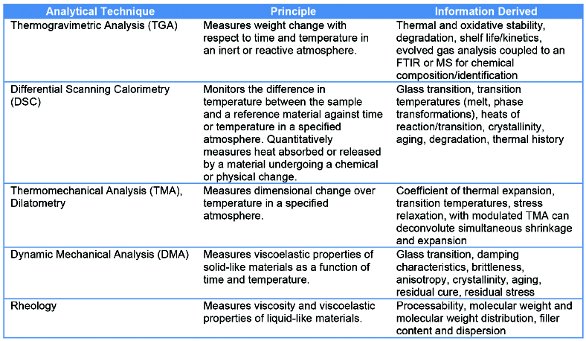
Oftentimes, a single cause of failure cannot be identified. The failure may have resulted from a combination of several factors that may be related to the list provided below. Materials failure may be due in part to the following four categories:2,3
- Improper selection of the material and additives used for a specific application; for example, replacing a material with a less expensive alternative that is not compatible with the process and application.
- Poor engineering design: Common design errors are related to abrupt geometrical changes, excessive wall thickness, sharp corners, limited understanding of the creep mechanism/rheology due to plastic viscoelastic properties, molded-in stress, environmental compatibility, draft , placement of ribs, and injection gates.
- Improper processing of the material: Excessive shear rates or quench profiles may lead to undesired orientation, residual stress, extrudate swell, and other unintended characteristics of the finished part.
- Misuse of the plastic part; for example, exposure at an elevated temperature that could result in degradation.
This article will focus on a DSC case study of a failed polyethylene terephthalate- based food storage container that has been stored in a freezer at a minimum of –18 °C. A comparison of the failed part was made to a good specimen that exhibited no failure or cracking. The cracking occurred primarily at feature boundaries, especially corners of ribs intended for structural reinforcement.
Polyethylene terephthalate (PET)
PET, depending on its processing, can be amorphous or semicrystalline. Typically the glass transition temperature occurs between 70 °C and 80 °C with a melt transition in the range of 250 °C to 260 °C. For several applications, it is normally in the amorphous morphology, which has very high transparency. Semicrystalline PET has good dimensional stability and scratch and chemical resistance but can be brittle. It can be blended with other polymers, such as polycarbonate (PC) and polybutyl terephthalate (PBT) to improve impact resistance and reduce brittleness.4
Conventional DSC involves heating a sample at a controlled, constant heating rate through a temperature range at which the material is thermally stable. Typically, a heat/cool/reheat profile is used (Figure 1). The first heat will assess the material’s properties in the as-molded condition. Processing and storage conditions can impact the glass transition temperature and initial crystallinity of PET. Heating the sample above the melt transition and the cooling at a controlled rate will erase the thermal history of the sample and impart a known thermal profile upon the sample. The second heat will evaluate the inherent properties of the material and can sometimes be used to differentiate various batches of a material.
 Figure 1 – Conventional DSC. A heat/cool/reheat profile of the uncracked PET sample.
In Modulated DSC (MDSC), a technique patented by TA Instruments (New Castle, DE), a controlled, single-frequency sinusoidal temperature oscillation is overlaid on the linear temperature ramp producing a corresponding oscillatory heat flow (i.e., rate of heat transfer) proportional to physical properties of the test specimen (Figure 2). Deconvolution of the oscillatory temperature and heat flow lead to the separation of the overall heat flow into heat capacity and kinetic components, called reversing and nonreversing heat flow. The overall heat flow (dQ/dt) may be described as the sum of a heat capacity (heating rate-dependent) term (Cpβ) (where Cp represents the heat capacity and β represents the heating rate) and a kinetic (time and temperature-dependent) term (f(T,t)).5
 Figure 2 – Modulated DSC. Initial crystallinity determination of the uncracked and cracked PET samples.
Modulated DSC enables the separation of the total measured heat flow into two constituents, providing increased understanding of simultaneously occurring phenomena in a sample. Figure 3 contains the deconvoluted heat flow signals for a sample of the uncracked PET food storage container. The total heat flow signal is the same as would be derived from a conventional DSC experiment at the same underlying heating rate. This signal represents the sum of all the thermal events. The reversing heat flow is the heat capacity component of the total heat flow (Cpβ), and contains the heat capacity-related events such as the glass transition, and often melting of the sample. The nonreversing heat flow is the kinetic component of the total heat flow (f(T,t)) and contains the kinetically controlled thermal events such as the cold crystallization, and crystal perfection, which occurs upon heating the sample into the melting region. This crystal perfection is not resolved in the total heat flow signal, as it occurs simultaneously with the more energetic melting process, and is thus concealed beneath the large melting. It is this ability to resolve previously undetectable transitions, and in this case to determine accurate initial crystallinity of the sample, that has made MDSC an invaluable tool in the field of polymer characterization.
 Figure 3 – Enthalpic recovery determination by MDSC.
Instrumentation, sample preparation, and test methods
A TA Instruments Q2000 DSC was used. The Q2000 DSC is a heat-flux DSC with Modulated DSC capabilities. Nominally 5-mg samples were cut from the area of failure (at the features of the molded part) and placed in an aluminum DSC pan with a standard aluminum lid. Both conventional DSC and Modulated DSC experiments were performed. The test methods are outlined below. Samples were tested under an inert nitrogen purge of 50 mL/min.
a) Conventional DSC (heat/cool/reheat):
- Ramp 10.00 °C/min to 300.00 °C (heat)
- Ramp 10.00 °C/min to –70.00 °C (cool)
- Ramp 10.00 °C/min to 300.00 °C (reheat).
b) Modulated DSC (heat-iso conditions for determining initial crystallinity):
- Data storage: Off
- Equilibrate at 20.00 °C
- Modulate ±0.32 °C every 60 sec
- Isothermal for 5.00 min
- Data storage: On
- Ramp 2.00 °C/min to 300.00 °C.
DSC analysis and results
Conventional DSC was used to determine the glass transition temperature (Tg) of the PET-based material. Modulated DSC was used to accurately determine the crystallinity of the sample, as well as to determine the extent of enthalpic recovery that occurred at the Tg as a result of aging. The glass transition temperatures from the first heat and second heat cycles of the standard DSC tests are shown in Table 2. The Tg on the first heat cycle for the cracked sample was significantly lower in value (71 °C) than the uncracked sample (75 °C). On second heating, the Tg values of both samples were comparable at ca. 82 °C. The difference in the Tg values from the first heat can reveal a difference in processing or storage conditions. Of particular interest is the presence of enthalpic recovery due to aging superimposed on the glass transition (see Table 2 and Figure 3).
Table 2 – The glass transition temperature (Tg) from the first and second heat cycles for the cracked versus uncracked PET containers
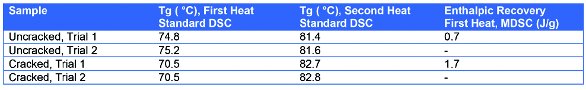
Physical properties of amorphous materials can change with time as the sample relaxes (enthalpic relaxation) toward a more enthalpically favorable equilibrium state. The process of enthalpic relaxation or “physical aging” results in a decrease in the energy content of the material. Since DSC and MDSC can measure the energy (heat) content of a sample, they are excellent tools for comparing differences in equilibrium between samples and therefore differences in expected end-use physical properties. At temperatures below the glass transition (Tg) of a material, amorphous structure has very low molecular mobility and is not in thermal equilibrium, that is, the energy content is higher than it should be and the material will gradually decrease in energy as it “ages” toward an equilibrium state. Once the material is heated above Tg, it has high molecular mobility and is in thermal equilibrium. Enthalpic recovery is the recovery of energy that the sample gave up (dissipated) as it relaxed toward an equilibrium state over time.6 The magnitude of the enthalpic recovery peak for the cracked sample is 1.7 J/g versus 0.7 J/g for the uncracked sample.
Because the PET sample undergoes a cold crystallization process as it is being heated, prior to the melting peak above 200 °C it can be difficult to determine the true heat capacity baseline for integrating the areas for crystallization and melting. The MDSC total heat flow signal (black) (see Figures 2 and 3) is identical to that from conventional DSC, showing only the sum of all heat flow. The reversing heat flow signal (blue) contains heat capacity, changes in heat capacity (i.e., glass transitions), and most melting. Clearly seen are the glass transition of the PET and melting of the PET.
The nonreversing heat flow signal (red) (see Figures 2 and 3) contains time-dependent or kinetic processes. It shows enthalpic recovery at the PET glass transition, cold crystallization of the PET starting just above 110 °C, and “crystal perfection” from just above the cold crystallization to the end of the melting peak near 270 °C. Crystal perfection is the process of the least perfect crystals melting at temperatures below the thermodynamic melting point and then crystallizing and melting one or more times as sample temperature increases.7
Initial crystallinity from MDSC data is calculated from the sum of all melting and crystallization observed in the reversing and nonreversing signals. Integration of heat flow in the nonreversing signal should begin at a temperature prior to any observed exotherm and end at a temperature above the melting peak (Figure 3). The initial crystallinity of the uncracked sample was found to be 31 J/g versus 10 J/g for the cracked sample.
Conclusion
The cracked sample had a Tg (first heat) of 71 °C, an enthalpic recovery of 1.7 J/g, and an initial crystallinity of 10 J/g. The good, uncracked PET-based container had a Tg of 75 °C, an enthalpic recovery of 0.7 J/g, and an initial crystallinity of 31 J/g.
Referring to a publication by Zhou et al.,8 the stress cracking behavior of semicrystalline PET is dependent on both crystallinity levels and physical aging. Samples with higher crystallinity undergo stress cracking failures at lower stresses than their less crystalline counterpart. However, the extent of physical aging further decreases critical stress values to shorter critical time to failure.8 The researchers found that when the amorphous content is restricted as a result of increased physical aging, the material becomes more susceptible to brittle fracture.
As we begin to interpret these data to correlate to failure, the following statements can be made:
- The cracked sample has more amorphous content than the uncracked sample. This amorphous content exhibited a larger enthalpic recovery due to aging than the good, uncracked sample. It appears that physical aging of the increased amorphous content of the failed sample had more of an effect on failure.
- DSC was used to detect morphological changes associated with aging in the material. DSC is a useful tool in the process of failure analysis; however, other analytical techniques should be engaged to develop a comprehensive outlook for the cause and mode of failure.
References
- Simon, G.P. Polymer Characterization Techniques and Their Application to Blends; Oxford University Press: New York, NY, 2003.
- Jansen, J.A. Characterization of Plastics in Failure Analysis; The Madison Group; http://www.madisongroup.com/publications/Jansen_ASM_Chapte_TMG2011.pdf.
- The Consultancy Centre at Smithers Rapra; http://www.rapra.net/consultancy/failure-analysis-trouble-shooting.asp.
- Ehrentein, G.W.; Riedel, G. et al. Thermal Analysis of Plastics—Theory and Practice; Hanser Publishers: Munich, Germany, 2004.
- Kraftmakher, Y. Modulation Calorimetry—Theory and Applications; Springer: New York, NY, 2004.
- TA Instruments Application Note, TP010: Measurement of the glass transition and enthalpic recovery.
- TA Instruments Application Note, TP011: Measurement of initial crystallinity in semicrystalline polymers.
- Zhou, H.; Lofgren, E.A. et al. Effects of microcrystallinity and morphology on physical aging and its associated effects on tensile mechanical and environmental stress cracking properties of poly(ethylene terephthalate). J. Appl. Polymer Sci. 2009, 112(5), 2906–17.
Kadine Mohomed, Ph.D., is Senior Thermal Applications Scientist, and David A. Bohnsack, Ph.D., is Marketing Manager, TA Instruments–Waters LLC, 159 Lukens Dr., New Castle, DE 19720, U.S.A.; tel. 302-427-4083/302-427-4001; e-mail: [email protected].