A spectrofluorometer has been specially optimized for recording near-IR fluorescence from nanoparticles, and offers a number of improvements over the previous version. The NanoLog® (double-grating excitation monochromator, imaging emission spectrograph with selectable-grating turret, and multichannel liquid-N2-cooled InGaAs array detector) (HORIBA Jobin Yvon, Edison, NJ) has optimal excitation optics for single-wall carbon nanotube (SWNT) research or any solid sample in right-angle or front-face mirror configurations (the xenon lamp and reference diode operate from 250 to 1000 nm; the excitation monochromator’s gratings blazed at 500 nm for excitation at 333–1000 nm). The emission spectrograph has selectable gratings in a turret mount for rapid, easy acquisition of near-IR spectra. One grating has single-shot coverage of >500 nm with detector wavelength range of 800–1700 nm (grating: 150 grooves/mm, 1200-nm blaze; detector: 512 pixels × 1 in. [2.5 cm]). The early version was equipped with a TRIAX 320 emission spectrograph, which has been upgraded to an iHR320.
System improvements
Improvements have been made to both the hardware and software, such as enhanced communications, i.e., a USB 2.0 hub for high speed and reliability, rather than the GPIB and RS232 serial ports found in the TRIAX. Inside the chassis of the iHR320 are improved mirror mounts and no wiring; all cables have been placed underneath the optical chamber for reduced stray light within the chamber. The chassis itself is machined from a single block of aluminum for higher durability, even in harsh environments, whereas the TRIAX was constructed from several metal plates. Filter wheels are possible internally and externally, rather than externally only, as with the previous system. A purge port, standard on the iHR320, is available only as an option on the TRIAX.
Spectral characteristics of the emission spectrograph have been improved upon as well. The standard step size is now 0.002 nm; this was optional on the TRIAX. Accuracy is ±0.20 nm versus ±0.3 nm. When using the internal grating turret, repeatability is ±0.15 nm, in contrast to ±0.075 nm. Image magnification, previously 1.0, is currently 1.1.
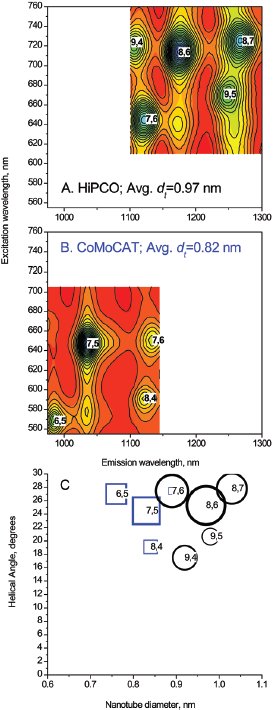
Figure 1 - Quantum excitation–emission (a and b) and helical (c) maps of HiPCO and CoMoCAT SWNT suspensions, using a NanoLog spectrofluorometer. Solid lines (a and b) are data; color contours are simulations. Symbol sizes (c) show relative amplitudes for HiPCO (circles) and CoMOCAT (squares), each normalized to 1. R2 values for the simulations are 0.997 (HiPCO) and 0.999 (CoMoCAT). Reprinted with permission from the Society of Photo-Optical Instrumentation Engineers (SPIE) Newsroom (http://newsroom. spie.org/), 10.1117/2.1200607.0326, in “Using Nanophotonics to Extract Structural Information on Single-walled Carbon Nanotubes."
Corrected emission spectra of carbon nanoparticles can provide excitation– emission matrices (EEMs) for a range of excitation wavelengths (detector dark signal and spectral response, and lamp output). Acquisitions take only minutes (using λexc = 500– 800 nm at 1-nm intervals; λem = 830–1350 nm at ~1 nm per pixel). EEMs are compiled by Nanosizer® software (HORIBA Jobin Yvon) to determine SWNT composition. A double-convolution algorithm (U.S. patent pending) in the software simultaneously computes excitation and emission wavelength coordinate lineshapes for each species, and contributions from all spectral bands in a region of interest are found. The simulation provides a precise analysis of SWNT composition on a PC in minutes. EEM data (Figure 1, solid lines) and simulations (contour maps) from two SWNT suspensions from two different manufacturing processes are distinguished in Figure 1 by their different size and helical distributions: high-pressure carbon-monoxide method (HiPCO, Figure 1a), and cobalt–molybdenum catalytic method (CoMoCAT, Figure 2b).1,2 HiPCO forms a broad size distribution of SWNTs (0.6–1.3 nm diam) with many helical angles and >50 species. CoMoCAT has a narrower average size (~0.8 nm diam) and smaller helical-angle distribution; just two species—(6,5) and (7,5)—comprise ~58% of the intensity. Figure 1a identifies five main HiPCO species, while Figure 1b identifies four main CoMoCAT species in the specified regions of interest. Figure 1c shows a comparative helical map of species found in Figure 1a and b, and plots the helical angle versus SWNT diameter (in nanometers) against intensity of emission (symbol size/color). Note that HiPCO tubes have a larger average diameter than CoMoCAT.
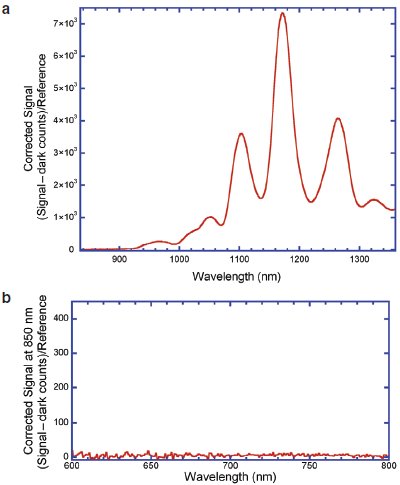
Figure 2 - Spectra of HiPCO nanotubes. a) Emission spectrum (λexc = 725 nm); b) excitation spectrum (λem = 850 nm). Spectra are corrected for both excitation inhomogeneities (via the reference detector) and dark counts. Plot (b) was used to calculate noise.
Signal-to-noise ratio
High S/N is critical to the unambiguous, rapid, quantitative determination of the multiple species invariably present in SWNT samples. The NanoLog is widely used in industry in the research and analysis of SWNTs; users include Samsung (Seoul, South Korea); Nikon (Tokyo, Japan); NASA Glenn Research Center (Cleveland, OH); Lawrence Livermore Laboratories (Livermore, CA); Singapore National University; NIST (Gaithersburg, MD); Massachusetts Institute of Technology (Cambridge, MA); Northwestern University, BIONAM Center (Evanston, IL); Lawrence Berkeley Laboratories (Berkeley, CA); and the University of Texas at Austin. While the S/N varies depending on the NanoLog’s configuration, to demonstrate the high S/N of the spectrofluorometer, the authors studied a sample of SWNTs prepared by the HiPCO method, which forms a broad size distribution of SWNTs (0.6–1.3 nm diam), with many helical angles and >50 species.1,2 The nanotubes were dispersed in sodium dodecylbenzenesulfonate (SDBS). The NanoLog consisted of a Fluorolog ®-3 spectrofluorometer (HORIBA Jobin Yvon) with a double-grating excitation monochromator (grating = 1200 grooves/mm; dispersion = 2.1 nm/ mm) and the iHR320 emission spectrograph (grating = 150 grooves/mm, dispersion = 20 nm/mm) coupled to an InGaAs array of 512 pixels. The sample was excited at 725 nm with a bandpass of 25 nm; the emission slit was also set to 25-nm bandpass with an integration time of 1 sec. Figure 2a shows an emission spectrum scanned from 835 to 1359 nm with known peaks, and a second excitation spectrum (Figure 2b) scanned from 600 to 800 nm to record noise at 850 nm. Dark noise was subtracted from both scans in Figure 2. Both dark corrected spectra were then corrected by dividing by a reference signal to remove source inhomogeneities. (The spectrofluorometer includes, as standard, a silicon photodiode reference detector located in the sample compartment just before the excitation light reaches the sample.)
The S/N is defined in Eq. (1):
The peak signal, Speak, is measured at the highest peak in (a), 1171 nm—the (8,6) species—and the noise, Sbackground, in a region with no signal (plot 1[b], 600–800 nm). An ideal system would give Sbackground = 0 at 600–800 nm. Thus, Eq. (1) becomes:
For scan (b), the average noise was 5.443, and the maximum signal was 7357.41 at 1171 nm, giving an S/N (via Eq. [2]) of 3151.
Time resolution
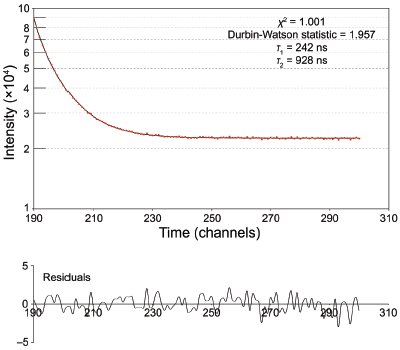
Figure 3 - Fluorescence decay of PbS polycarbonate quantum dots in CHCl3. The upper plot shows the decay; the lower plot the residuals to the fit. Small residuals plus excellent χ2 and Durbin-Watson statistics indicate that the data fit well to the model.
The NanoLog can be fitted with a time-correlated single-photon counting (TCSPC) system. Figure 3 shows an example of data recorded with this scheme. The sample was a solution of quantum dots (lead sulfide and polycarbonate) dispersed in chloroform (supplied by Evident Technologies, Troy, NY). A pulsed laser diode (50 kHz, l = 980 nm, pulse-width ≈450 ps) excited the sample. Emission was recorded at 1465 nm with a bandpass of 64 nm using multichannel scaling on a R9170-75 near-IR photomultiplier tube (Hamamatsu Corp., Iwata, Japan). Time per channel was 100 nsec. Measurements were continued until the peak channel reached 100,000 counts. Reconvolution was unnecessary when fitting the decay, since the laser pulse occupied only one channel.
Using a bi-exponential model, χ2 = 1.001 and a Durbin-Watson statistic equal to 1.957 were found, indicating an excellent fit to the data in Figure 3. The two recovered lifetimes for the quantum dots were τ1 = 242 nsec and τ2 = 928 nsec.
The NanoLog is also available with TCSPC multichannel-scaling options of 500 nsec/channel and 2 nsec/channel, as well as a 5509 photomultiplier tube (Hamamatsu).
Conclusion
The NanoLog, recently upgraded with an iHR320 emission spectrograph, sets the industry standard for near-IR fluorescence of nanoparticles. With a high signal-to-noise ratio and good time discrimination, the NanoLog is a multifaceted instrument for the most advanced work in nanotechnology research.
References
- Resasco, D.E.; Alvarez, W.E.; Pompeo, F.; Balzano, L.; Herrera, J.E.; Kitiyanan, B.; Borgna, A. A scalable process for production of single-walled carbon nanotubes (SWNTs) by catalytic disproportionation of CO on a solid catalyst. J. Nanoparticle Res. 2002, 4, 131–6.
- Bachilo, S.M.; Balzano, L.; Herrera, J.E.; Pompeo, F.; Resasco, D.E.; Weisman, R.B. Narrow (n,m)-distribution of single-walled carbon nanotubes grown using a solid supported catalyst. J. Am. Chem. Soc. 2003, 125, 11,186–7. (For a review of SWNT applications, see also Baughman, R.H.; Zakhidov, A.A.; de Heer, W.A. Carbon nanotubes—the route towards applications. Science2002, 297, 787–92.)
Dr. Gilmore is Applications Scientist, and Dr. Cohen is a Technical Writer, HORIBA Jobin Yvon, 3880 Park Ave., Edison, NJ 08820, U.S.A.; tel.: 732-494-8660; fax: 732-549- 5125; e-mail: [email protected]. Dr. Sagoo is Applications Scientist, HORIBA Jobin Yvon IBH Ltd., Glasgow, U.K. Much of the material in this paper was presented as a poster entitled, “Single Walled Carbon Nanotube Analysis: Rapid, Robust Acquisition and Simulation of Quantum and Chiral Maps to Ease Structural Assignments,” at Pittcon® 2006 (Orlando, FL). The authors thank Evident Technologies (Troy, NY) for use of the quantum-dot samples.