The previous article (Part 35, American Laboratory, Aug 2009) introduced the concept of significant digits, pointing out that a statistically sound treatment will: 1) result in a formula that depends only on the uncertainty associated with the measurement and 2) allow for fractions of a significant digit. The relationship involves the use of logarithms [(log base 10) will be used throughout], so is not linear in the magnitude of the uncertainty. This installment will expand on the previous discussion.
Several conventions are used throughout, thereby eliminating the need to keep track of the powers of 10 associated with: 1) the measurements and their uncertainties and 2) the conversion of relative uncertainties to percents. Details are below.
First, all measurements and related uncertainties are in concentration units. Second, measurements are expressed in scientific notation (i.e., there is a single digit to the left of the decimal point and the entire number is then multiplied by the appropriate power of 10). Thus, the expressions of all concentrations will fall between 1.0 and 9.99+. Third, relative uncertainties are expressed as decimal (i.e., proportional) results (i.e., will not be converted to a percent).
The fourth and final convention requires a little explanation. Uncertainties are expressed in “modified scientific notation.” In other words, the decimal format will be such that the power of 10 applied to the measurement will also apply to the uncertainty. As an example, (123456 ± 789) would be written as [(1.23456 ± 0.00789) * 105]. If both a measurement and its uncertainty are in the same power of 10, then these powers will “cancel out” in any calculations.
As was shown in Part 35, the main formula for the number of significant digits is:
d = log (0.5) + 1 – log (u),
where d = the number of significant digits and u = the uncertainty (i.e., the half-width of the prediction interval associated with the measurement; this interval has connected with it a user-chosen confidence level). The number of significant digits will not be positive if the logarithm of the uncertainty becomes too high. The cutoff is ~0.7, which is the approximate value of [log (0.5) + 1].
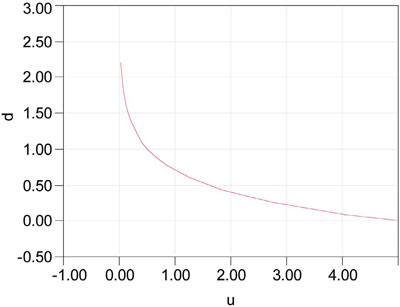
Figure 1 - The number of significant digits (d) associated with uncertainties (u, in concentration units) ranging from 0.01 to 5.
In reality, the range of uncertainties obtainable for a given analytical method has a floor of ~0.01. Such a value translates into a relative uncertainty of ~0.01, if the measurement is 1. This degree of “tightness” is about the best that can be achieved for such a method. Figure 1 shows the number of significant digits that can be obtained for the uncertainty range of 0.01 to 5 (if the measurement is just under 10, an uncertainty of 5 gives a relative uncertainty of ~0.5, which is typically the highest such value any user would ever tolerate).
Note that even when u is as low as 0.01, not even three significant digits can be guaranteed. This reality should make analysts (and users of data) think seriously about the wisdom of reporting a long string of digits for any given result. Note also that when u inflates to ~5, then d is 0 [i.e., log (5) ≈ 0.7, the cutoff mentioned earlier]. As soon as u rises above 5, then d becomes negative.
Recall that if measurements and their uncertainties are expressed in “modified scientific notation,” then d depends solely on u (i.e., d is independent of the power of 10 associated with the measurement and its uncertainty). Thus, within any decade of concentrations [i.e., (1.0 *10n) to (9.99 * 10n), where n = any integer], d is independent of concentration, as long as u does not change over the concentration range. In other words, when ordinary least squares (OLS) is the appropriate fitting technique, d will be nearly constant throughout any decade of concentration, since u (i.e., the width of the prediction interval) changes little (assuming an adequate number of data points are incorporated into the regression). If the concentration range spans more than one decade of concentrations, then d will increase by 1 each time a new decade is entered.
What if weighted least squares (WLS) is needed for the fitting technique (i.e., the variation is not constant over the concentration range)? The prediction interval will flare, meaning that the absolute uncertainty will not be constant and thus d will change, too. In these situations, the relative uncertainty is often constant. Recall from Part 35 that the basic formula for d can be rewritten in terms of the relative uncertainty (ru) and the concentration (c):
d = log (0.5) + 1 – log (ru) – log (c)
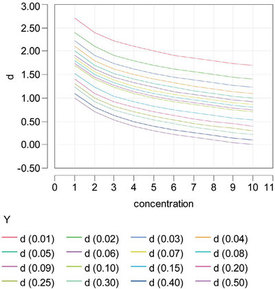
Figure 2 - Relationship between the number of significant digits (d) and concentration, for various values of relative uncertainty (ru). In the legend, the value of ru is given in parentheses.
In this version of the formula, d depends on both ru and c [remember, ru = u/c, or ru * c = u; hence, log (ru) + log (c) = log (u)], and d will change with concentration. The relationship can be seen graphically in Figure 2. The family of plots (each curve represents a given level of ru) shows that a specific number of significant digits can be achieved in more than one way (i.e., via more than one combination of c and ru).
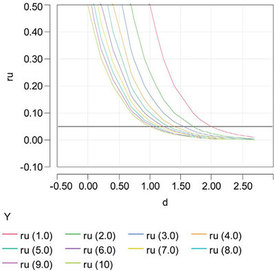
Figure 3 - Relationship between relative uncertainty (ru) and the number of significant digits (d). Each curve represents a different concentration (given in parentheses in the legend). The black reference line shows the minimum ru (0.05) that must be achieved to ensure at least one significant digit at all concentrations.
Figure 3 is an alternate way of depicting the relationship between ru and d (each curve represents a specific concentration). Note that no matter what the concentration, it is impossible to ensure even one significant digit unless ru is at least as low as 0.05.
The above four paragraphs can be summarized as follows. Over a given concentration range, how d behaves depends on how u behaves. If u is constant (OLS), then d is constant for each decade of concentration. If u changes with concentration (WLS), then d will also change with concentration.
Finally, consider the relationship between significant digits and detection limits. Recall from a previous installment (Part 34, American Laboratory, May 2009) that at the Hubaux-Vos detection limit (H-V DL), the ru is 0.5 (if α = β, as is typically the case). In the ru version of the formula for d, [log (0.5) – log (ru)] is now 0. Thus,
d = 1 – log (c)
If c is its lowest possible value (i.e., 1), then d = [1 – log (1)] = 1. If c is its largest value (i.e., 9.99 or ~10), then d = [1 – log (10)] = 0. Thus, at the H-V DL, d will fall between 0 and 1, depending on the concentration. In other words, at the detection limit, there may be as few as 0 significant digits (which is consistent with the concept of detecting, but not reporting). The user must decide if a measurement value should be reported if d is this low.
Mr. Coleman is an Applied Statistician, Alcoa Technical Center, MST-C, 100 Technical Dr., Alcoa Center, PA 15069, U.S.A.; e-mail: [email protected]. Ms. Vanatta is an Analytical Chemist, Air Liquide-Balazs™ Analytical Services, 13546 N. Central Expressway, Dallas, TX 75243-1108, U.S.A.; tel.: 972-995-7541; fax: 972-995-3204; e-mail: [email protected].