The requirement to ensure the quality of incoming raw materials as well as finished products in the food, drug, and cosmetics industries is crucial, and FTIR spectroscopy is widely used for this purpose. When these compounds are liquid, the analyst currently has two choices for analysis methodology—transmission spectroscopy or attenuated total reflectance (ATR) spectroscopy.
Prior to 1980, only the transmission method was widely used for the analysis of liquids by mid-IR spectroscopy. Transmission cells were generally classified as two types: sealed or variable pathlength. Sealed cells were factory-set at a fixed pathlength and constructed with window materials appropriate for the application. Liquid samples were typically introduced into sealed cells by syringes and Luer-lock type fittings. These cells were acceptable for less viscous liquids, but suffered from filling and cleaning problems when more viscous liquids were measured. Variable pathlength cells featured demountable windows that allowed the operator to adjust the pathlength required for a specific application by using precut spacers, typically made of PTFE. These cells offered more flexibility than the fixed pathlength cells, but suffered from leakage and problems with fringing that would affect the performance.
After 1980, ATR-type liquid cells began to appear in significant numbers. Because these devices tended to be far easier to use, their popularity increased to the point where ATR today (for both solids and liquids) is the most widely used sampling technique for mid-IR spectroscopy. For ATR, the pathlength of measurement is defined by the depth of penetration of the evanescent wave, which is wavelength dependent, multiplied by the number of reflections. Thus, the maximum pathlength that can be achieved by the typical ATR element material (diamond or ZnSe) is typically not more than about 12–15 μm. ATR is quite effective for shorter pathlength measurements (neat liquids or mid-IR opaque solutions with higher-concentration analytes), whereas for longer pathlength mid-IR measurements, transmission spectroscopy employing the fixed or variable pathlength cells described above is still the standard.
Analyzer description

Figure 1 - The DialPath sampling interface is integrated into the compact ML Analyzer, creating a fully functional, dedicated mid-IR liquids analyzer.
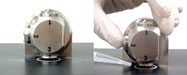
Figure 2 - The ML Analyzer with DialPath Technology allows users to change between three factory-calibrated, fixed pathlength selections in seconds.
A new means of measuring liquids uses a technology with the variable pathlength capability of classic transmission cells, while at the same time offering the ease of use and simplicity of the ATR method. The device, the ML Analyzer with DialPath™ Technology (Figure 1) (A2 Technologies, Danbury, CT), features an optical head that can be rotated to select one of three factory-calibrated, fixed pathlengths between 30 and 250 μm. To analyze a sample, a drop of the liquid is placed on a stationary infrared-transparent window mounted on the top surface of the analyzer, and then a second window is rotated into position, thus sandwiching the sample between the two windows (Figure 2). This creates a highly reproducible, fixed sample pathlength between the two windows. For lower-concentration samples, one of the longer pathlength window sets is selected; for samples that are more concentrated, a shorter pathlength combination is used. Wiping cleans the two windows and prepares the device for the next sample. The analyzer has many advantages over the older transmission cell technology:
- It permits nearly instantaneous selection of three different pathlengths as needed
- No disassembly is required to change pathlengths
- No spacers are required—cell leakage and fringing are eliminated
- No autosamplers or syringes are needed to introduce sample
- Liquids of varying viscosity can be handled equally effectively
- Sample cleanup is very quick
- Samples can be analyzed rapidly
- No supplies or consumables are required
- The analyzer utilizes 8 square inches of bench space.
Application example: Verification of identity and determination of impurity levels in additives used in foods, drugs, and cosmetics
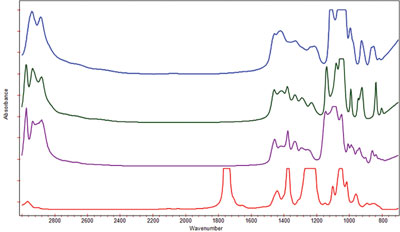
Figure 3 - Spectrum of product compounds recorded using the DialPath 30-μm pathlength. Blue = glycerol, red = triacetin, green = propylene glycol, and purple = dipropylene glycol.
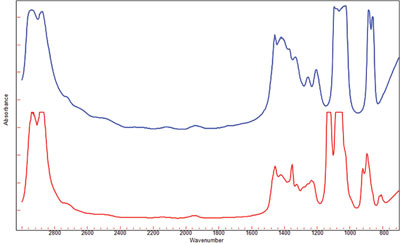
Figure 4 - Spectra of ethylene glycol (blue) and diethylene glycol (red) impurities recorded using the 30-μm pathlength. Spectra are similar to each other and to the spectra of the product compounds.
Liquid propylene glycol, glycerol, triacetin, and dipropylene glycol, which are used as additives in foods, drugs, and cosmetics, were analyzed by the ML Analyzer with DialPath Technology to verify their identity and overall purity. In order to obtain high-quality mid-IR spectra, the short, 30-μm pathlength was selected to permit optical transparency of the sample. The spectra (Figure 3), consisting of 64 coadded interferograms at 4 cm–1 resolution, took approximately 30 sec to collect. These spectra were then compared to reference spectra contained in an on-board library, which yielded a match quality of better than 0.99 for each (scale of 0–1.000, with 1.000 being a perfect match). The quality of the match confirms the gross identity and purity of the four liquids.
Present in these product compounds are low-level impurities that must be measured, since there is a specific threshold value that cannot be exceeded for human use. Neat samples of the two major impurities, ethylene glycol and diethylene glycol, were measured using the 30-μm pathlength window set. The spectrum of each impurity is similar to one another (Figure 4) and also to that of the pure compounds. In order to determine the level of these impurities, a series of calibration samples were made up that varied the amount of both impurities in each of the individual compounds. The infrared absorbance of the impurity bands will increase proportionately to concentration, as Beer’s Law states. Separate calibrations were developed using a partial least squares (PLS) algorithm for each of the impurities in the compounds. The PLS chemometrics allows for accurate modeling of the molar absorptivity of the ethylene glycol and diethylene glycol absorbance bands of interest in each of the additives.
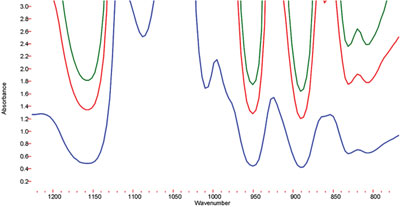
Figure 5 - For glycerol, the 100-μm pathlength is too opaque and the 30-μm pathlength does not provide an adequate limit of detection for the impurities. The 75-μm pathlength provides the necessary sensitivity to detect impurity levels.
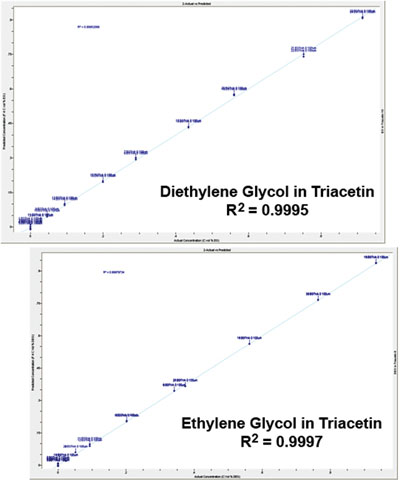
Figure 6 - Calibration plot of impurities shows very good R2 values and limits of detection of 0.04 vol% for each.
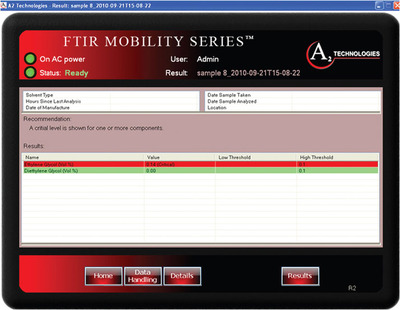
Figure 7 - The ML software displays analysis results for the level of ethylene glycol impurity in glycerol. The red color band shows that the level of impurity is outside of specification.
Because the spectra of the impurities and additives are so similar, specific wavelength regions were used for the measurement. For example, in the case of glycerol, the spectral regions from 875 to 905 cm–1 and 1130 to 1200 cm–1 were found to be effective for measuring the impurity bands. However, the 100-μm pathlength was found to be too long, obscuring the bands of interest (Figure 5), and the 30-μm pathlength did not provide the level of sensitivity required to measure the impurities. For this reason, the 75-μm pathlength was selected to carry out the analysis. The latter pathlength provides enough transparency in the region of interest, and also provides adequate pathlength to measure the impurities. PLS-based calibrations for the impurities in glycerol (Figure 6) were found to have R2 of 0.9895 for ethylene glycol and 0.9745 for diethylene glycol. Based on these calibrations, limits of quantitation (LOQ) of approximately 0.075 vol% and limits of detection (LOD) of 0.04 vol% were obtained for both impurities in glycerol. Since the limit of quantitation is well below the FDA limit of 0.1 vol%, the user can be confident that the glycerol is clean, and the much lower LOD gives the user the ability to optimize the production process to minimize the contaminants in these compounds. The ML Analyzer with DialPath Technology software presents these results in a format that enables the user to obtain the quantitative results numerically, as well as via a color bar indicating whether action needs to be taken (Figure 7). The color bar threshold values can be chosen, set, and changed, if necessary, by the methods development chemist.
The measurement of impurities in glycerol is an excellent example of the importance of being able to select the correct pathlength to achieve optimum sensitivity in a critical measurement. Because of the viscosity of glycerol, the analyst might choose an ATR method for the measurement since traditional transmission liquid cells are difficult to fill with viscous liquids. The ATR method would result in a very good-quality spectrum of the neat glycerol, but, because of its limited pathlength, the method would not provide the levels of quantitation of the impurities that the 75-μm pathlength achieves. Yet, the DialPath Technology is as easy to use as an ATR cell, both for sample introduction and sample cleanup.
Similar procedures were carried out for the detection of the ethylene glycol and diethylene glycol impurities in the triacetin, propylene glycol, and dipropylene glycol additives. As an example, for the detection of these impurities in triacetin, it was found that the 100-μm pathlength provided the optimum results. This is because triacetin has relatively transparent regions in its spectrum between 812 and 939 cm–1 and 1100 and 1200 cm–1, which are well suited for detecting the impurity bands. Triacetin is even less optically opaque in this region than in the previous example of glycerol, enabling the use of the longer pathlength. Calibration of the impurities in triacetin via PLS yielded R2 values for ethylene glycol and diethylene glycol of 0.9997 and 0.9998, respectively, with limits of detection of 0.04 vol% for ethylene glycol and 0.02 vol% for diethylene glycol. Measurement of triacetin samples using these calibrations indicates that the levels of impurities are within the correct specification range; however, diethylene glycol is detected at low levels (0.04% or 400 ppm), which may warrant closer attention.
Overall value of the analyzer
The ML Analyzer with DialPath Technology offers QA/QC, methods development, and analytical service personnel significant new capabilities and advantages:
- The analyzer features compact size, performance, ease of use, and robustness. This permits highly accurate and precise measurements of samples requiring low levels of quantitative detection with a system that occupies the minimum amount of critical benchtop space.
- DialPath Technology is seamlessly integrated with the ML Analyzer, resulting in optimized performance, ease of use, and the ability to process samples very rapidly.
- The technology eliminates the need to use consumables such as windows, spacers, solvent streams, and syringes, and eliminates leaks, fringing, and other inherent problems of classical transmission cells.
- DialPath Technology reduces the need to use ATR for the measurement of neat liquid samples, yet allows the measurement of low-level impurities that ATR does not have the sensitivity to achieve. One technology covers the entire range of mid-IR liquid measurements.
- As a result of the ease and speed of measurement, the number of samples that can be analyzed per unit time in many cases eliminates the need to use autosamplers with their inherent cost and complexity, including the requirement to use solvents to clean between samples. This latter necessity creates solvent waste disposal issues and has the potential to affect quantitative results due to sample carryover.
Conclusion
Overall simplicity is the main reason ATR analysis of neat liquids and/or of higher-concentration analytes has become popular. ATR, however, offers limited pathlength choices and is far less effective for measuring lower-concentration analytes. This is well illustrated in the examples given in this article, where the goal was to quantitatively measure low-level analyte impurities, with spectra similar to those of the desired products, in order to ensure that the incoming additives were within manufacturing specification. In this example, transmission measurements were necessary to achieve the limits of quantitation required, but doing so with traditional liquid transmission cells is cumbersome and potentially less accurate, particularly for liquids as viscous as glycerol.
The ML Analyzer with DialPath Technology allows the user to quickly and accurately select the correct longer pathlength needed for detecting lower-level analytes, and provides the ability to choose a shorter pathlength for use in gross identification of liquids. At the same time, the technology enables these measurements to be carried out as easily and quickly as ATR for the shorter pathlength situations. In fact, DialPath Technology obviates the need to use ATR for the measurement of neat liquids to verify identity since it is just as fast and easy to use as ATR.
Mr. Higgins is Application Scientist, and Dr. Rein is VP of Market Development, A2 Technologies, 14 Commerce Dr., Danbury, CT 06810, U.S.A.; tel.: 203-312-1100; fax: 203-312-1058; e-mail: [email protected].