Real-time quantitative PCR (qPCR) has become a definitive technique for quantitating differences in gene expression levels between samples. Over the past 10 years, the popularity of the method has grown exponentially, with the publication of over 25,000 papers making reference to RT (reverse transcription)- qPCR data.
The biotechnology industry has responded to the rapid adoption of this technique with the development of reagents and instruments to perform RT-qPCR experiments. However, since no strict guidelines have been established, researchers have generally designed their experiments based on information gathered from disparate sources, which has resulted in data of variable quality.
In an effort to assist the scientific community in producing consistent, high-quality data from qPCR experiments, the minimum information for publication of quantitative real-time PCR experiments (MIQE) guidelines has been recently published.1 This has been followed by the development of an XML-based real-time PCR data markup language (RDML) for the consistent reporting of real-time PCR data by the RDML consortium.2 Information about the RDML project is available at www.rdml.org/.
The ultimate goal of RDML and MIQE is to establish a clear framework within which to conduct RT-qPCR experiments and to provide guidelines for reviewers and editors to use in the evaluation of the technical quality of submitted manuscripts against an established yardstick. As a consequence, investigations that use this widely applied methodology will produce data that are more consistent, more comparable, and ultimately more reliable.
Given the highly dynamic nature of mRNA transcription and the potential variables introduced in sample handling and in the downstream processing steps,3 a standardized approach to each step of the RT-qPCR work flow is critical for reliable and reproducible results. The MIQE provides this approach with a checklist that contains 85 parameters to ensure quality results that will meet the acceptance criteria of any journal,1 and these criteria have recently been simplified in a concise, eight-step experimental approach to qPCR.4
This paper demonstrates how to apply the MIQE guidelines (http://medgen.ugent.be/rdml/guidelines.php) to establish a solid experimental approach.
Experimental design
Table 1 - RT-qPCR experimental design and sample management*
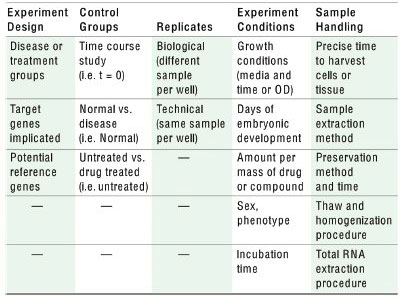
*This table summarizes the work flow of a typical RT-qPCR experiment from experimental design to defining control groups, replicates, and experimental conditions to the detailed procedures for sample handling. This ultimately ensures that the key steps in RT-qPCR data production lead to high-quality, reproducible, and publishable data.
Proper experimental design is the key to any gene expression study. Since mRNA transcription can be sensitive to external stimuli that are unrelated to the processes studied, it is important to work under tightly controlled and well-defined conditions. Taking the time to define experimental procedures, control groups, type and number of replicates, experimental conditions, and sample handling methods within each group is essential to minimize variability (Table 1). Each of these parameters should be carefully recorded prior to conducting gene expression experiments and then followed to ensure good biological reproducibility for published data.
RNA extraction
If samples must be collected over a period of time or in too large a number to process immediately, they should be stored in appropriate conditions (frozen at −80 °C and/or in RNA storage solution) until use. To minimize handling time during the RNA extraction procedure, it is recommended that samples be processed in relatively small batches of 10–20. The RNA extraction procedure should include a DNase I treatment step to remove any contaminating genomic DNA. Many commercially available kits, such as the Aurum™ RNA extraction kits (Bio-Rad Laboratories, Inc., Hercules, CA) can be used for virtually any sample type from plant to animal tissue and include an on-column DNase I treatment of the samples.
RNA quality control
Ensuring that only RNA of high purity (no contaminants) and high integrity (not degraded) is extracted from samples is one of the most critical points in the RT-qPCR experimental work flow. Impurities may lead to inhibition of the reverse transcription reaction, yielding biased data. Use of partially degraded RNA can lead to varying and incorrect quantification results.5,6 Since sample purity and integrity are not related, both should be assessed to ascertain that the RNA sample meets minimal acceptance criteria for the downstream work flow.
 Figure 1 - Analysis of RNA purity and integrity. This figure shows an example of RNA purity and integrity analysis using spectrophotometry and the Experion™ automated electrophoresis system (Bio-Rad). Mouse liver total RNA samples were subjected to degradation by heating at 90 °C for different periods of time and analyzed for both purity and integrity. Green boxes highlight the fact that the total RNA sample appears by absorbance readings alone (≥1.8) to be of sufficient quality, whereas RNA quality indicator (RQI) integrity measurement on the Experion system clearly shows degraded sample with low RQI values. a) Virtual gel image generated by Experion software showing various degradation levels of the RNA samples and a progressively decreasing intensity of the 18S ribosomal RNA (rRNA) band. b) The OD260/280 ratio measured for all samples on the NanoDrop spectrophotometer (Thermo Fisher Scientific, Waltham, MA) is between 1.8 and 2.0, indicating that the samples are devoid of protein contamination. c) Summary of RNA integrity analysis using Experion software. The 28S/18S rRNA ratio and the RQI indicate a decreasing integrity of the heat-treated RNA samples. A color classification allows for easy identification of the samples that are not adequate for qPCR. d) Example of qPCR analysis of GAPDH expression performed on degraded samples.6 The profiles show increasing Ct with the degraded samples.
Purity of the sample with respect to protein contamination can be assessed spectrophotometrically by measuring the OD260/280 ratio, which is optimal between 1.8 and 2.0 (Figure 1b). However, no RNA integrity information can be obtained from a spectrophotometric reading.
RNA integrity can be assessed using several methods. The traditional method is visual inspection after electrophoresis on a formaldehyde agarose gel in the presence of a fluorescent dye such as ethidium bromide. Observation of two sharp bands for the large and the small subunit rRNA with the intensity of the larger band in the range of equal to about twice that of the smaller band is indicative of intact RNA. While this method is inexpensive, the interpretation of the data is mostly subjective and requires approximately 200 ng of total RNA, which may be difficult if the sample is only available in limited quantities.
A major improvement in RNA integrity analysis came with the introduction of microfluidics-based electrophoresis systems,7 such as the Experion automated electrophoresis system, which combines integrity and concentration quantification of RNA in a single step from nanogram or picogram quantities (Figure 1a and 1c). In addition to generating a virtual gel, an electropherogram, and calculating the 28S/18S ratio, the Experion system’s software automatically calculates and reports an RQI value (Figure 1c) that reflects the integrity of the RNA sample based on several criteria8 of the electropherogram. The system also provides quantification of RNA concentration to normalize samples for the subsequent reverse transcription step.
By ensuring consistency in both purity and quality across all RNA samples, variability between biological replicates can be reduced (Figure 1d).7 When a batch of RNA samples has successfully met the standards of quality control, it is recommended that they be used immediately in RT-qPCR experiments, or their conversion into much more stable cDNA by reverse transcription to preserve RNA integrity after the quality check.
Reverse transcription
Given the prevalence of RNase in the environment, it is recommended that the reverse transcription of total RNA samples to cDNA be performed immediately following the quality control assessment. This will avoid the risk of RNA sample degradation from multiple freeze/thaws before conversion to cDNA. For the RT step, the key is to ensure consistent and complete coverage of the transcribed genome in the extracted RNA sample. Some genes are very long, but the associated RT products for these sequences cannot be as large, especially if the RT primers anneal only at the ends of each mRNA. By annealing primers at the end of the mRNA plus at random points within each mRNA sequence, a good sampling of the population of each gene is obtained. This method, which is more representative than just annealing at the ends or at random sites within each transcript, provides better coverage of the transcribed genome.