Wavelength-scanned cavity ring-down spectroscopy (WS-CRDS) is fast gaining worldwide acceptance as a superior tool for trace gas analysis, because it combines operational simplicity and portability with parts-per-billion sensitivity, species selectivity, and quantitative precision, as well as a linear dynamic range up to percent concentration levels. Very recently, commercial WS-CRDS instruments have been configured to bring a similar combination of simplicity and precision to stable isotope measurements, most notably for CO2 and H2O. In the case of H2O, both oxygen (δ18O) and hydrogen (δD) isotope ratios are simultaneously measured directly from liquid or vapor samples with no special preparation required. Furthermore, the overall cost per measurement is much lower than for traditional isotope ratio mass spectrometry (IRMS) instruments, yet the precision and sensitivity are similar, and even better in some instances. Moreover, these WSCRDS instruments have minimum drift and memory; thus frequent calibration is completely unnecessary. As a result, WSCRDS isotope analyzers are already finding application in fields as diverse as monitoring for leaks of fossil-fuel CO2 at geosequestration sites and research into carbon/water cycles, as well as for total organic carbon (TOC) measurements.
This article discusses the principles of WS-CRDS instrumentation, and presents applications data that illustrate some of its important capabilities. WS-CRDS is a laser-based, linear optical absorption technique in which a gas sample is introduced into a high-finesse optical cavity and the optical absorbance of the sample is measured, thus providing concentration or isotopic ratio measurements of a particular gas species at high data sampling rates (up to 10 Hz). In addition, instrumentation based on WS-CRDS has a relatively small form-factor, and has several other attributes that make it ideally suited for measurements that would otherwise be impossible using traditional gas measurement technologies. The key benefits of WS-CRDS can be summarized as follows:
- Parts-per-billion sensitivity and precision even in complex and changing gas matrices
- Extremely high chemical specificity with no cross-talk with other gas species or with changes in ambient conditions
- Supports remote unattended operation
- Very low zero and span drift over months of operation
- Continuous measurements with data rates up to 10 Hz
- Isotopic ratios without sample purification or concentration.
In addition, WS-CRDS-based analyzers are field-deployable, enabling a host of point-of-interest measurements that are difficult, if not impossible, using conventional technology. For example, in greenhouse gas (GHG) applications, the unique attributes of WS-CRDS have allowed worldwide networks to be developed that can continuously and remotely monitor methane and carbon dioxide at the ppb level with extremely low drift and operating cost. Plus, these portable instruments can simultaneously deliver the δ13C isotopic ratio, which is a characteristic signature of the origins of CO2. In petrochemical applications, the unique specificity of WS-CRDS permits it to be used to measure acetylene and ammonia at the ppb levels in constantly changing ethane and ethylene process streams. This enables optimization of the ethane/ethylene gas purity, thus allowing the user to place a premium on the end product.
Understanding the basic principles of WS-CRDS
Although the full benefits of WS-CRDS are best utilized when the laser is operated in continuous-wave (CW) operation, the fundamentals of WS-CRDS are more easily understood by first considering a laser operating in pulsed mode.
Pulsed-mode cavity ring-down
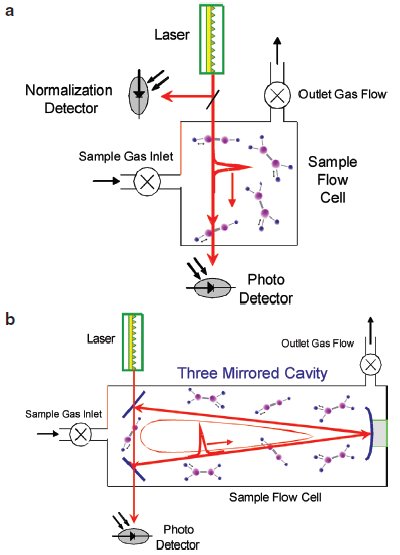
Figure 1 - a) Block diagram of the basic components that make up a very simple intensity-based optical absorption measurement. b) Block diagram of a simple WS-CRDS system modified from (a) by removing the normalization detector and including an optical cavity.
Figure 1a shows the basic components that make up a very simple intensity-based optical absorption measurement. In this configuration, a single, very short-duration pulse of narrow-line laser light is injected into a sample cell where the laser pulse has the opportunity to be absorbed by gas molecules if the laser is at a wavelength corresponding to a near-infrared absorption line. The optical loss at that particular wavelength is then proportional to the pulse intensity measured on the photodetector divided by the pulse intensity measured on the normalization detector. The precision of the measured optical loss is primarily governed by two factors: 1) the distance through which the pulse of light passes through the sample (optical pathlength), and 2) the ability of the two photodetectors to measure light precisely.
In WS-CRDS, the traditional laser intensity absorption measurement is turned into a highly accurate time-based measurement. This time-based absorption measurement is accomplished in the following way: Start with the traditional setup shown in Figure 1a. Now modify it by removing the normalization detector and replacing the sample cell with an optical cavity made up of partially reflecting mirrors. The result is a very simple WS-CRDS analyzer. A block diagram of this WS-CRDS configuration is shown in Figure 1b. As before, a single pulse of light is injected into the empty sample chamber (no gas yet) through one of the partially reflecting mirrors. Once in the cavity, the single pulse of light reflects off of each of the three mirrors as the pulse repeatedly circulates (travels from mirror to mirror to mirror) within the cavity. As the circulating pulse impacts the surface of each mirror, a small portion of its light is transmitted through the mirror, and the intensity of the circulating pulse decreases. The light transmitted through the mirror can then be measured using a photodetector. The total light lost by the pulse on each round trip is equal to the loss of all three mirrors.
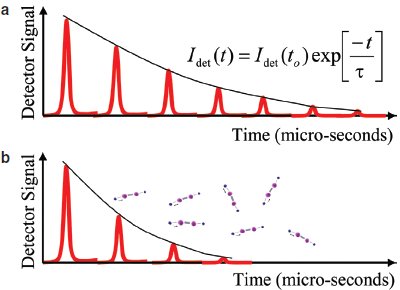
Figure 2 - a) Time sequence of pulses leaving the cavity (as seen by the photodetector) as a single light pulse circulates in the cavity along with the relationship between the ring-down data and characteristic ring-down time. b) Time sequence of pulses leaving the cavity when an absorbing gas species is introduced.
Figure 2a shows the time sequence of pulses leaving the cavity (as seen by the photodetector) as a single light pulse circulates in the cavity. The envelope of this series looks the same on an oscilloscope as the decay of sound when a bell is struck and measured using a microphone (the bell is “ringing down”), hence the name “ring-down.” Let us consider what happens when the sample chamber is filled with an absorbing gas. In this case, the total light lost while circulating in the cavity is proportional to the loss due to the cavity mirrors plus the light absorbed by the molecules. Figure 2b shows a time sequence of pulses leaving the cavity when an absorbing gas species is introduced. Note that the decay of the circulating light is faster than in an empty cavity. Thus, the rate of decay of light is governed by the total loss in the cavity.
In the case of WS-CRDS, the optical loss at a particular wavelength (λ) is related to the rate of decay of light circulating in the cavity through δ = 1/cτringdown, where τ is the characteristic ring-down time, c is the speed of light, and δ is the loss per unit length. To obtain the loss, the characteristic ring-down time (τ) is determined by fitting the ring-down using the formula shown in Figure 2a. The optical loss is then calculated using the characteristic ring-down time. By scanning the laser wavelength over a spectral feature of interest, measuring τ and thus the loss at each wavelength, the line profile can be precisely obtained. The concentration of the gas species of interest is proportional to the area under its measured spectral feature. (This wavelength scanning, in conjunction with a very accurate wavelength monitor, is crucial for accurate fitting of the line intensity, and ultimately is an important factor supporting the extremely high precision of WS-CRDS.)
Continuous-wave WS-CRDS
In continuous-wave WS-CRDS, light from a CW laser is injected into the cavity. The light intensity inside the cavity then builds up over time and is monitored using a photodetector. In CW operation, the “ring-down” measurement is made by rapidly turning off the laser and measuring the light intensity in the cavity as it decays exponentially in time. Figure 3 shows the intensity of light as seen by the photodetector as light builds up in the cavity and “rings-down” after the laser is shut off.
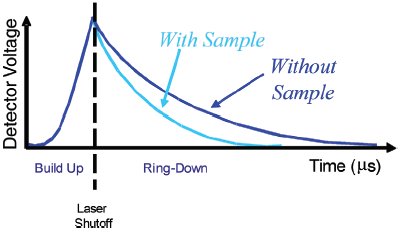
Figure 3 - Continuous-wave WS-CRDS. Intensity of light as seen by the photodetector as light builds up in the cavity and “rings-down” after the laser is shut off.
One key advantage of WS-CRDS over traditional spectroscopic techniques is its very long optical pathlength. Depending on the reflectivity of the cavity mirrors, a single light pulse can circulate in the cavity for hundreds of microseconds before decaying to zero, thus producing an effective pathlength of tens of kilometers through the sample. Much like a multipass cell, this very long effective pathlength gives WS-CRDS its extremely high sensitivity.
Another important advantage of WS-CRDS over many other measurement techniques is that a “zero” gas is not required. As the laser is scanned over an absorption feature, the resulting spectrum is the sum of the absorption spectra of the gas sample and the “baseline” optical loss of the cavity (e.g., with no gas or nonabsorbing gas). Analysis of the measured spectrum determines the constituent quantities in the gas sample. Detailed spectral analysis of the total spectrum also determines the baseline loss, without the need to measure a baseline spectrum separately. Thus, the analyzer can measure the sample gas continuously, and does not require the measurement of a nonabsorbing “zero” gas.
A third advantage is the fact that WS-CRDS is a “passive” measurement. The laser is shut off during the ring-down measurement. This results in no contribution from laser intensity fluctuations to the WS-CRDS measurement of optical loss, in stark contrast to traditional absorption techniques.