An all-digital cantilever controller for magnetic resonance
force microscopy (MRFM) was developed through
a close collaboration between SC Solutions (Sunnyvale,
CA), Cornell University (Ithaca, NY), and the
U.S. Army Research Laboratory (Adelphi, MD). The
advantage of an all-digital controller is its absence of
thermal drift as well as its great tuning flexibility. The
versatile controller comprises a field-programmable gate
array (FPGA) connected via a low-latency interface to
an analog input, an analog output, and a digital signal
processor (DSP) with additional analog outputs. Performance
of the controller was demonstrated in experiments
employing ultrasensitive silicon microcantilevers
fabricated at Cornell University’s Nanoscale Science
and Technology Facility.
The scientific questions we can ask are largely determined by
the quality of characterization technology available. In the
1980s, the scanning tunneling microscope (STM) generated
tremendous excitement because it enabled one to “see” and
manipulate individual atoms and molecules at a surface for
the first time, opening the door to resolving long-standing
questions about surface bonding, reactivity, and catalysis
at metal and semiconductor surfaces. The invention of the atomic force microscope (AFM) (and related scanned probe
microscopes) brought nonconductive surfaces
into view.1 The resulting ability to generate
nanometer-resolution surface maps of chemical
forces, magnetization, and charge has revolutionized
materials science.
The invention of the magnetic resonance
force microscope by John Sidles in 1991
offered scanned probe microscopy two exciting
new analytical capabilities: imaging subsurface
features and imaging with unambiguous
isotopic chemical contrast.2–4 Pushed to its
limit, MRFM has the potential to obtain the
full three-dimensional structure of any single
molecule. Such progress would be a revolutionary
advance, if it can be realized.
Imagine the scientific puzzles that could be
addressed with a “molecular microscope” capable
of nondestructively imaging the coordinates
of all the protons in any single molecule.
Such an instrument would allow us to form a
three-dimensional picture of any single protein,
in situ, with all of its post-translational
modifications in place.
- It would enable us to obtain the full structure of any
membrane protein and we could look at any cell’s outer
membrane with all the proteins and lipids frozen in
action together
- It would allow us to focus study on just the reactive part of
a molecule or a suspected binding site in a protein. Such
an instrument would open the door to studying impure
samples, samples that can be isolated in only small quantities,
and transient complexes
- It would permit us to study the conformational heterogeneity
among an ensemble of proteins in situ.
The magnetic resonance force microscope is a sensitive
new technique for detecting nuclear magnetic moments
(and unpaired electrons).5,6 MRFM is providing researchers
the unprecedented ability to acquire, nondestructively,
a three-dimensional image of subsurface nanoscale
features with isotopic selectivity. The instrument will be
invaluable to researchers and product developers in the
semiconductor, materials, and biotechnology industries.
The goal of the research reported here was to develop
an all-digital cantilever controller for a prototype magnetic
resonance force microscope capable of ultimately
detecting the nuclear magnetic resonance signal from one
proton. The paucity of tools for imaging materials with nanoscale resolution is presently a significant barrier to
the development of such technologies. The research summarized
here represents a significant step toward development
and commercialization of a magnetic resonance
force microscope for studying organic material at the
nanoscale.
Cantilever control
Within scanned probe microscopy (SPM), active control of
the cantilever is needed for several reasons:
- Fast damping of the cantilever is needed to increase imaging
speed in AFM. Cantilevers with a high quality factor
have lengthy ring-down time (many tens of seconds) that
slows imaging
- AFM imaging with constant frequency and/or imaging
with constant amplitude will provide different images.
Both types of imaging require feedback control
- In MRFM mode, the cantilever thermomechanical oscillations
can be many nanometers. These random oscillations
must be damped to below 0.1 nm rms if atomic-scale
imaging resolution is to be achieved
- As the cantilever approaches a surface, its natural frequency
can change significantly. For many applications,
it is favorable or required to track and measure the cantilever
frequency continuously.
To accommodate these requirements, a generic cantilever
controller was proposed, as shown in Figure 1.
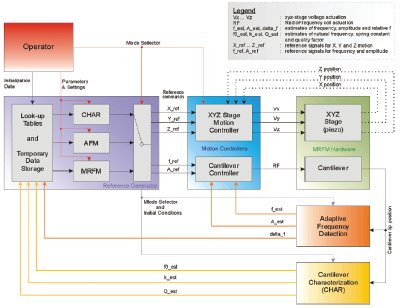
Figure 1 - Schematic of generic cantilever controller, including low-level motion controllers, as well as high-level characterization and detection algorithms.
Current analog cantilever controllers suffer from significant
thermal drift and are not easily tunable.7–10 To overcome
this, an all-digital cantilever was developed that
combines frequency shift measurements, phase shifting
and amplitude control, as well as positive feedback control
for driving the cantilever at resonance frequency.11–13
The versatile controller comprises a field-programmable
gate array connected via a low-latency interface to an
analog input, an analog output, and a digital signal processor
with additional analog outputs.
Hardware design
For the feedback controller, a C6711 DSP-based system
(Texas Instruments, Dallas, TX) tightly coupled to a
Virtex-II FPGA (Xilinx, San Jose, CA) was chosen. The
FPGA communicates directly through digital data lines to
a fast (80-MHz) analog-to-digital converter (ADC) and
digital-to-analog converter (DAC).
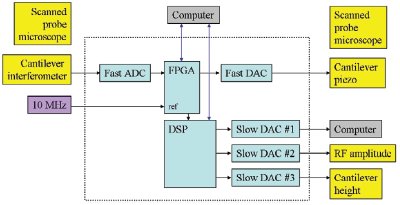
Figure 2 - Block diagram of cantilever controller. The scanned probe microscope provides a cantilever position signal, digitized at 80 MHz by the ADC, which passes it to the FPGA. The FPGA sends a phase-shifted AC signal to a fast DAC, which is used to drive the cantilever at its resonance frequency, thus closing the control loop. A DSP is used to set registers in the FPGA as well as control slow DACs.
As can be seen in Figure 2, the signal path is SPM—ADC—FPGA—DAC—SPM. The scanned probe microscope system
provides a signal that is proportional to a cantilever position. The
ADC digitizes this signal at 80 MHz and passes it to the FPGA.
The FPGA computes an estimate of the cantilever’s frequency,
amplitude, and phase. It also sends a phase-shifted AC signal to
a fast DAC, which is used to drive the cantilever at its resonance
frequency, thus closing the control loop. By using the FPGA to
perform all the calculations in the critical path of the control
loop, the overall system latency is reduced by eliminating the
need to pass data to and from the DSP over its input/output bus.
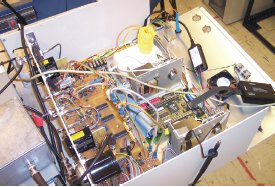
Figure 3 - Photograph of controller hardware installed at Cornell University. The stacked FPGA/DSP cards can be seen slightly right from the center.
The DSP controls the FPGA by setting the values of several
registers in the FPGA that determine the characteristics
of the control loop. The DSP also sets the values in three
slow (1-MHz) DACs. The slow DACs will be used for other
aspects of the scanned probe microscope. One is used to produce
a voltage proportional to the cantilever frequency, and
another controls RF power levels. This leaves the third DAC
free to control, for example, the height of the cantilever.
The 10-MHz clock reference for the ADC/DAC is externally
provided from a stable, low-phase-noise crystal. The
FPGA multiplies the 10 MHz up to 80 MHz using a digitally
locked loop (DLL), and this 80-MHz signal becomes the
clock for the ADC/DAC. The authors chose to provide the
10 MHz from an external source instead of using a DSP-generated
clock reference to guarantee that the reference
had low-phase noise. To obtain the rated accuracy of the
ADC/DAC, low-phase-noise clocks must be used. A photograph
of the completed all-digital cantilever controller
hardware is shown in Figure 3.
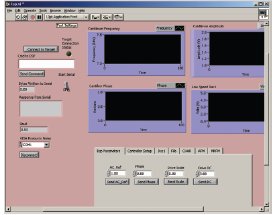
Figure 4 - Screenshot of the LabVIEW user interface (National Instruments, Austin, TX), which controls the hardware by setting control registers in the FPGA. The software also monitors the estimated frequency shift of the resonating cantilever.
Software interface
Figure 4 shows the main user interface. Key features are the
selection of the mode of operation, the display of relevant
data, e.g., the current estimate of the cantilever frequency
and/or frequency shift, as well as the magnitude of the cantilever
signal. Another feature is setting up the connection
with the target.

Figure 5 - Apparatus used to test the cantilever controller. a) Photograph of the scanned probe microscope head, b) schematic showing the cantilever approaching the surface in a perpendicular orientation to avoid snap-in to contact, and c) SEM of the cantilever. The scale bar is 10 μm.
Experimental setup
The experimental setup is shown in Figure 5. A custom-fabricated
silicon cantilever with resonance frequency of
roughly 7 kHz was brought within a distance d of approximately
5 μm of a gold surface. This is far enough away from
the surface that the cantilever is not affected by van der Waals
forces or friction, but close enough so that the cantilever
frequency can be shifted by applying a voltage Vtip between
the cantilever and the gold substrate. In the following experiments,
the voltage Vtip was stepped up to induce a frequency
shift that mimics an MRFM signal from nuclear or electron
spins below the sample surface. In this way, we can fully demonstrate
the performance of the digital cantilever controller
by detecting small frequency shifts without having to set up
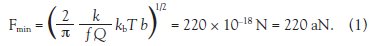
a full MRFM experiment. The cantilever parameters were
spring constant—k = 7.4 × 10⁴ N/m, resonance frequency: f =
7373 Hz, and quality factor: Q = 2.8 × 10⁴. The operating conditions
were—temperature: T = 300 K, pressure: P ~ 1 × 10⁶
Torr, rms cantilever drive amplitude: zrms = 55 nm, and detection
bandwidth: b = 5 Hz. Under these operating conditions,
the minimum detectable force is calculated to be: