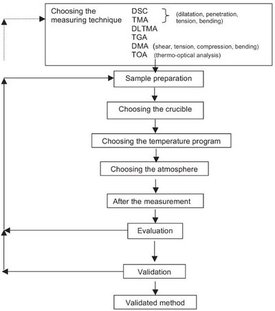
Figure 1 - Procedure for developing a thermoanalytical method. DLTMA: dynamic load thermomechanical analysis.
The development and validation of methods is of major importance in today’s quality assurance systems. The starting point is usually a trial method that is then optimized and validated in several iterative steps. The final result is a validated method that is used for standard operating procedures (SOPs). The development and validation of a measurement procedure is time-consuming and costly. Thus it is important to start off with a good trial method right from the beginning. This article attempts to systematize the development of thermoanalytical methods and discusses the most important aspects involved. Figure 1 presents an overview of this process.
Step 1: Choosing the right measurement technique
The analytical task
Method development begins with precisely defining the information one hopes to obtain from an analysis of the sample. Some typical questions are:
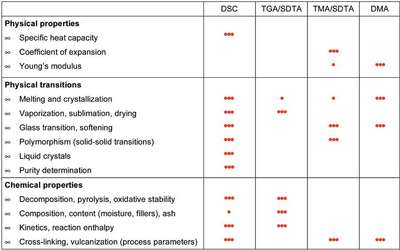
Figure 2 - Overview of the application possibilities of different thermoanalytical techniques: 3 dots means very suitable; 1 dot means less suitable.
- At what temperature does the glass transition occur?
- Does the sample exhibit polymorphism?
- How pure is the product?
- What is the moisture content of the sample?
Depending on the analytical task and the information required, one first has to decide which measurement technique to use. Figure 2 presents an overview of the application possibilities of various thermoanalytical measurement techniques.
Sensitivity
The most important considerations at this point are basic questions that have to do with later validation of the method:
- Is the sensitivity of the method good enough to obtain the desired information?
- What possible consequences arise from the sensitivity of the method, e.g., with regard to sample size or heating rate?
- What accuracy can one expect to achieve?
- Is the accuracy sufficient for one’s purposes?
- Do any interfering effects have to be taken into account? Are the effects more serious with one measurement technique than with another (robustness of method)?
To answer these questions, one needs to understand the operating principles of the instruments and to have had practical experience. Particularly important is information on the signal-to-noise ratio, long-term stability or drift, and measurement reproducibility. Question: What is the smallest mass loss step that can be resolved by thermogravimetric analysis (TGA) ? Answer: The decisive point in this case is the signal-to-noise ratio of the measurement signal (balance and surroundings). As a rule of thumb, a measurable mass change should be at least four times greater than the background noise signal. Assuming that the noise is 1 μg, the minimum step height is 4 μg. If the sample mass is 10 mg, this means that mass changes on the order of 0.4 per thousand can be measured. However, the accuracy with which such a small mass step can be measured also depends on the width of the step. An example of a very low mass loss step is shown in Figure 3.
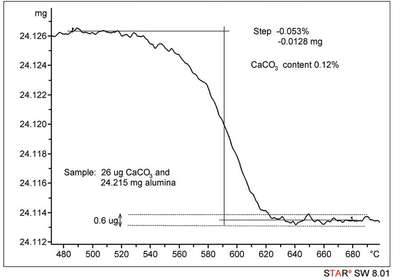
Figure 3 - Calcination of 28 μg calcium carbonate in 24.215 mg aluminum oxide. The CaCO3 loses CO2 up to about 600 °C (calcination). From stoichiometric considerations, a step of 12.3 μg is expected from the decomposition reaction of calcium carbonate.
Here, the “accuracy of a measurement” (related terms also used are trueness or bias) is the closeness of agreement between the mean value of a set of results and the accepted true value of the quantity. Accurate results of course require good precision. Precision is the closeness of agreement between independent measurement results on identical samples. It is a measure of the scatter or spread of the measurement results and is usually expressed as the standard deviation (often calculated as the relative standard deviation or the coefficient of variation). In the case of a purity determination, for example, it was known that the true value for the degree of purity of the sample was 98.4%. The result of a purity determination by differential scanning calorimetry (DSC) was 98.6 ± 0.1%. The deviation from the true value (i.e., the accuracy) is therefore 0.2%, and the precision 0.1%. Whether this is acceptable or not depends on one’s own requirements and is a matter to be considered in the validation.
Measurement mode
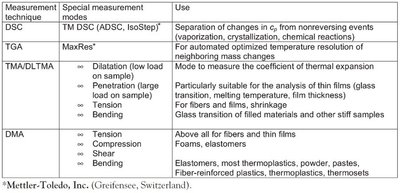
Figure 4 - Special measurement modes for different TA techniques and their applications.
Once a particular measurement technique has been decided upon (here, DSC, TGA, thermal mechanical analysis [TMA], or dynamic mechanical analysis [DMA]), the next question concerns the measurement mode in which the instrument is to be operated. Figure 4 summarizes various instrument-specific measurement modes and their uses.