Compounds such as antibiotics, over-the-counter medicines, and caffeine drain through the sewage system largely unaltered into rivers and streams, and even enter the drinking water supply in very small amounts. In order to monitor the trace pharmaceuticals in surface and groundwater, an effective sample preparation and analysis method is required.
In 1999, the United States Geological Survey (USGS) (Lakewood, CO) National Water Quality Laboratory (NWQL) developed and implemented an Oasis HLB (Waters Corp., Milford, MA) solid-phase extraction (SPE) method and an HPLC-MS method to analyze pharmaceuticals. In December 2007, the U.S. EPA introduced Method 1694, “Pharmaceuticals and Personal Care Products in Water, Soil, Sediment, and Biosolids by HPLC/MS/MS” for monitoring PPCPs in our environment.1 Using the multiple reaction monitoring (MRM) technique, any interference and matrix signal from organic matters in the water can be minimized from the target compound signals for better confirmation and quantitation. In this article, SPE and LC-MS/MS methods are described to analyze 19 pharmaceuticals in positive ion mode and 11 pharmaceuticals in negative ion mode.2
Experimental
Sample preparation procedure (refer to Ref. 3 for more information):
- Filter water samples in the field or laboratory using 0.7-μm glass fiber filters.
- Pump 1 L of the filtered water sample at a flow rate of 10 mL/min through an Oasis HLB SPE cartridge containing 0.5 g of sorbent.
- Elute the Oasis HLB column with 6 mL of methanol followed by 4 mL of 0.1% TFA (trifluoroacetic acid) in methanol.
- The resulting solvent extract is then concentrated to approx. 100 μL.
- Add internal standard (ISTD). The extract is reconstituted to 1 mL.
Calibration standards: For positive ion mode, nine calibration solutions were prepared: 1, 5, 10, 20, 40, 100, 200, 400, and 1000 pg/μL. For negative ion mode, six levels were used: 10, 20, 40, 80, 400, and 800 pg/μL.
Table 1 - Instrumentation: Positive
ion mode
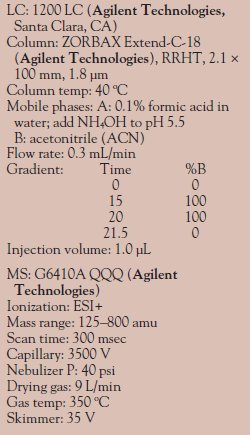
Table 2 - Instrumentation: Negative
ion mode
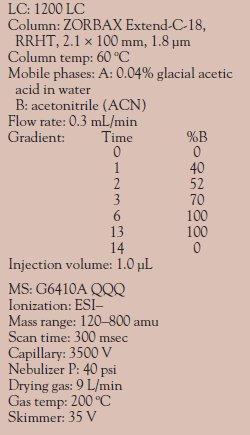
Instrumentation information for positive ion mode and negative ion mode is provided in Tables 1 and 2, respectively. The MRM parameters for positive ion mode and negative ion mode are listed in Tables 3 and 4, respectively.
Table 3 - Positive ion mode MRM method parameters

Table 4 Negative ion mode MRM method parameters

Results and discussion
The analysis time in negative ion mode is less than 7 min for the 11 analytes. Their peak widths are about 0.1 min, using a 1.8-μm particle size column. The narrower peak width gives a higher signal-to-noise ratio (S/N) compared to a 3.5-μm or larger particle size column.
A few compounds, for example, ketoprofen, are sensitive to heat from the drying gas. Higher drying gas temperature (350 °C) lowers the intensity of the precursor ions. Therefore, in the negative ion mode, the drying gas temperature was set to 200 °C.
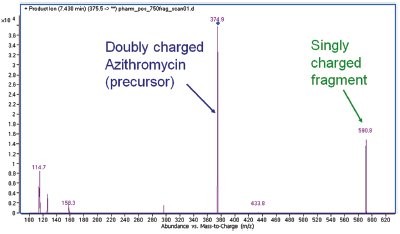
Figure 1 - Doubly charged precursor results in a fragment at higher m/z.
In Figure 1, it was interesting to see that the fragment ion actually had a higher m/z value than the precursor ion. For azithromycin, the doubly charged ion showed higher intensity than the singly charged ion and was chosen as the precursor. Therefore, depending on the precursor chosen, it is sometimes necessary to set the upper mass of the product ion scan to be higher than the precursor ion.
Table 5 - Linearity: 1, 5, 10, 20, 40,100, 200, 400, and 1000 pg on-column (ESI+), origin included, no weighing

Table 5 shows the linearity results of all 19 pharmaceuticals (ESI+) over the range of 1, 5, 10, 20, 40, 100, 200, 400, and 1000 pg on-column. Two calibration models were used: a linear model and a quadratic model that both included origin with no weighting. Some of the compounds showed significant fitting improvement from the linear model to the quadratic model.
Table 6 - Repeatability from six
injections at 5 pg/μL (5 pg on-column), ESI+
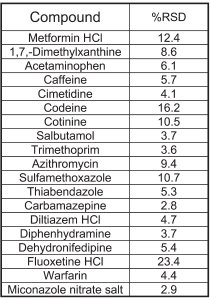
Table 7 - Linearity: 10, 20, 40, 80,
400, and 800 pg on-column
(ESI–), origin included, no
weighing

Table 6 shows the repeatability results from six injections of 5 pg of each analyte on-column. In general, the RSDs are below 15%, except for fluoxetine, which was at 23%.
Table 7 shows the linearity results of all 11 pharmaceuticals (ESI–) over the range of 10, 20, 40, 80, 400, and 800 pg on-column. All the R2 values were above 0.99, except triclocarban, which was about 0.97.