The beginning of the 1960s witnessed
the widespread introduction of
physical sciences methods and techniques
in archaeology. Along with instrumental
neutron activation, X-ray fluorescence (XRF) analysis was among the first
techniques to be applied to archaeological
research,1,2 and the subsequent collaboration
between archaeologists, geologists, and
chemists provided archaeology with a new
ability to employ instrumental measurement
techniques to determine, with a great
degree of confidence, the parent geological
source materials from which prehistoric
obsidian artifacts were manufactured.
Obsidian, a natural volcanic glass, was one
of the first materials to be subjected to XRF
analysis because of its distinctive chemical
properties. Since obsidian is, in essence, a
supercooled silica liquid, its chemical composition—major, minor, trace, and rare earth elements—is usually quite homogeneous,
and researchers quickly discovered
that each obsidian “source” (more properly,
a distinctive chemical entity) usually
possessed a unique combination and
concentration of elements (often termed a
chemical “fingerprint”) that allowed parent
geologic eruptive sources to be distinguished
chemically from one another. This
chemical distinctiveness allowed researchers
to pinpoint the geologic “source” for
archaeological artifacts and, by using ancillary
dating information, to identify change
and continuity in the prehistoric use of particular
obsidian sources through time.
Archaeological issues
Despite the benefits of instrumental techniques
like XRF for achieving archaeological
goals, one of the limitations has been the
difficulty of analyzing very small, thin obsidian
specimens that typically occur in western
North American archaeological sites as
chipping waste and artifact manufacturing
residue. In addition to taking into consideration
X-ray geometry issues, X-ray absorption,
and matrix effects,3-7 for quantitative analysis
most matrix-correction
algorithms require that the sample being analyzed is sufficiently
thick so that the measured concentration does
not change as a function of sample thickness.
Samples that meet this criterion are sometimes
referred to as being "infinitely thick" for
the elements of interest. Hughes8 showed that relatively large obsidian artifacts, even those
biconvex and lenticular in cross-section,
were adequate to satisfy these requirements
for certain trace elements, but problems were encountered when analyzing very small obsidian
flakes (i.e., those <10 mm in diameter and <ca. 1.5 mm thick).
Small obsidian samples (i.e., those not infinitely
thick or infinitely thin) pose problems
for nondestructive quantitative energy-dispersive X-ray fluorescence (EDXRF) analysis
in part because as the specimen becomes
smaller and thinner the proportion of X-rays
emitted from the sample decreases in relation
to those contributed by surrounding
media.9 This can be compensated for to a
certain extent by using a primary beam collimator
but, depending on the amount of
collimation, the number of incoming X-rays
from the sample can be reduced to the point
that analysis times become prohibitive for
very small artifacts. Using a 75-kV tube, special
filters, and secondary targets, Giauque et
al.9 have successfully generated precise quantitative
EDXRF data for small obsidian samples,
but their customized analytical setup is
difficult to replicate with commercially available
EDXRF units that typically offer a much
more limited set of X-ray tubes and primary
and secondary filter options. A different analytical
approach has been applied here for
the analysis of small obsidian specimens.
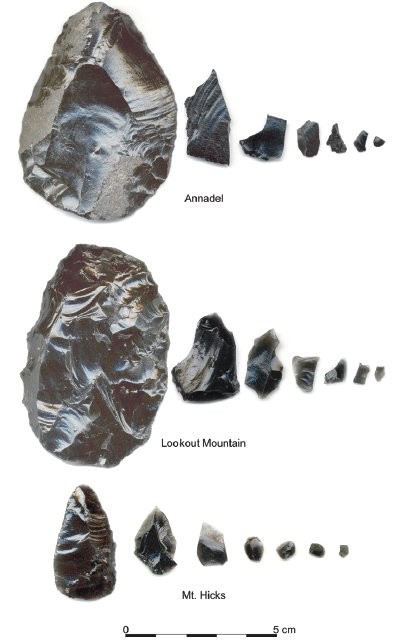
Figure 1 - Obsidian samples from Annadel, Lookout Mountain,and Mt. Hicks showing the size range of flakes subjected to EDXRF analysis (see Table 1). Note: The dimensions of the smallest specimen (those at the far right in the figure) analyzed from each source are as follows. Annadel sample G: length = 3.07 mm, width = 3.37 mm,thickness = 0.46 mm, weight = 5.5 mg; Lookout Mountain sample G: length = 5.43 mm, width =3.21 mm, thickness = 0.87 mm, weight = 11.7 mg;Mt. Hicks sample G: length = 4.32 mm,width =3.24 mm, thickness = 0.57 mm,weight = 7.7 mg.
Early in the history of archaeological obsidian
characterization, Robert Jack10-12 noted the
advantages of using certain mid-Z elements
(those between 37 and 41 in atomic number)
to fingerprint obsidian sources, pointing out
that because these elements are adjacent to
one another in the periodic table, very similar
excitation and detection efficiencies could
be achieved, thus facilitating direct comparison
of adjacent element relative intensities.
Although Jack and Carmichael's research employed wavelength-dispersive X-ray fluorescence (WDXRF), this same basic approach
can be utilized via EDXRF analysis because
elements adjacent in atomic number have
X-ray emission lines that are close in energy.
For this reason, matrix effects, sample thickness,
and X-ray geometry issues affect each
element in the same way, and ratios of the
fluorescent emission line intensities between
and among elements are highly stable. Unlike earlier WDXRF analyses, however, those conducted
by EDXRF13 are significantly faster,
taking as few as 30 live time seconds to generate
large numbers of counts for mid-Z elements,
due to the high-flux end window
X-ray tubes and digital signal processing in
use today. The present work, an outgrowth
of research conducted over the past few years
(e.g., Hughes14,15), was undertaken to illustrate
the utility of EDXRF analysis for characterizing
small obsidian flakes and to demonstrate
the applicability of this research to archaeological
studies.
Experimental
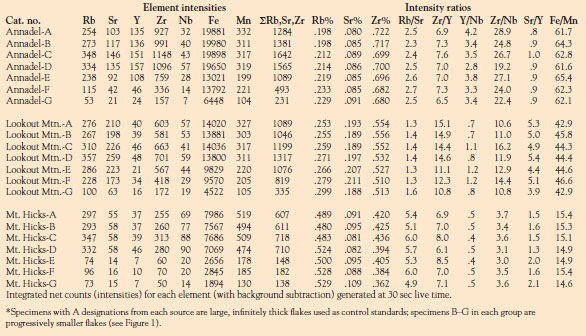
Table 1 - Integrated net peak intensity data for obsidian samples from Annadel, Lookout Mountain, and Mt. Hicks*
Laboratory tests on obsidian samples were
conducted using a QuanX-EC™ (Thermo
Fisher Scientific, Waltham, MA) EDXRF
spectrometer equipped with an end window
silver (Ag) target X-ray tube, 50-kV
X-ray generator, digital pulse processor with
automated energy calibration, and Peltiercooled
solid-state detector with 145-eV
resolution (FWHM) at 5.9 keV. The X-ray
tube was operated at differing voltage and
current settings, and with different primary
beam filters, to optimize excitation of the elements selected for
analysis. In this case analyses were conducted for Rb, Sr, Y, Zr,
Nb, Fe, and Mn using the Ka emission line
for each element. The analyses were conducted
for 30 dead time-corrected seconds,
with tube current scaled to compensate for
the physical size of the specimen. Background
and peak overlaps were subtracted
to generate integrated intensity net count
rate data for trace elements between 25 and
26 and 37 and 41 in atomic number.
To facilitate controlled comparisons
between large obsidian artifacts (those of sufficient
physical thickness to generate reliable
quantitative composition estimates)
and smaller, thinner obsidian samples (of
insufficient physical size to generate replicable
and reliable quantitative composition
estimates), integrated net count data for a
suite of trace elements were first generated
on suitably large in-house geologic reference
standards. Geologic obsidian samples from
three well-known western North American
obsidian sources—Annadel, located in the
North Coast Range of northern California;
Lookout Mountain, located in the Casa Diablo
area of central eastern California; and
Mt. Hicks, located in southwestern Mineral
County, Nevada—were collected and an
experienced flintknapper used one obsidian
cobble from each source to make an obsidian
artifact. All manufacturing debris from each
cobble was saved, and was sorted by size class
before being subjected to EDXRF analysis.
Figure 1 illustrates the size range of the obsidian
samples used in this analysis.
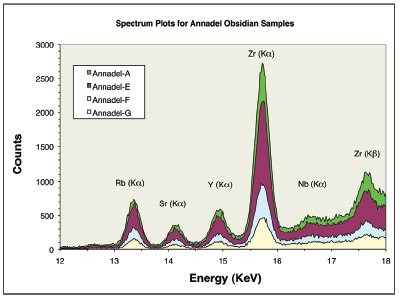
Figure 2 - Mid-Z spectra of three Annadel obsidian samples. All specimens were detached from the same obsidian cobble, sorted by size. A = the largest specimen,G = smallest specimen.
Integrated net count rate data for large samples
were generated, and these served as the
baseline control for each obsidian source. Following
these analyses, integrated net count
rate data were then obtained for very small
flakes (many <4 mm in diameter) detached
from large geological samples from each
obsidian source using the same analysis conditions
applied to large samples (see Table 1).
Resulting data for each element of interest
were compared directly to values obtained
from the baseline control groups to determine
whether the same substantive result
was achieved. As Table 1 shows, although
higher numbers of counts were generated on
larger, thicker specimens, the ratios of counts
between large and very tiny, thin flakes are
practically identical (see Figure 2).
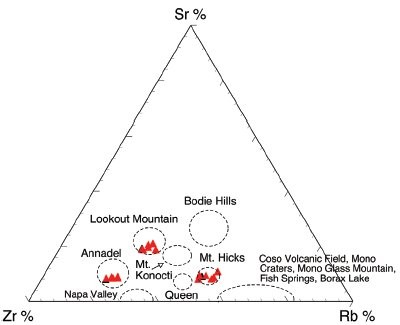
Figure 3 - Ternary diagram plot showing the relative net peak intensity proportions of Rb, Sr, and Zr in geologic samples from Annadel, Lookout Mountain, and Mt. Hicks obsidian sources in relation to other regionally significant obsidians. Black triangles plot infinitely thick samples from each source; red triangles plot smaller flakes in Table 1.
Figure 3 illustrates these concordances
using Rb/Sr/Zr ratio data, while Figure 4
shows them using Zr/Y versus Rb/Sr ratios.
Lower count rates were achieved for very
small specimens principally because the
X-ray beam excitation area was only minimally
filled by the small target samples,
which were held in place in a sample cup
using very thin (ca. 4 µm) polypropylene
film. Use of a primary beam collimator
helped to more precisely focus the X-ray
beam on each tiny sample, but reducing
the beam size dramatically decreased the
count rates for very small samples, meaning
that counting time would have had
to be extended significantly in order
to achieve adequate numbers of counts.
Given the goals of this study, the count
rates/second achieved were adequate to draw distinctions between the
trace element compositions of
these obsidians.