Thermal analysis, like most mature technologies, sees mostly incremental increases in its capabilities, such as the introduction of modulated temperature techniques1 in the early 1990s or the development of fast scan DSC in 2002.2 Both of these techniques addressed issues in materials characterization and were widely adopted in various forms. The latter showed exceptional promise since it allows tremendous increases in throughput for the working laboratory.
Another set of enhancements to thermal techniques has been awaiting commercialization. The ability to hyphenate various thermal instruments to improve the quality and quantity of information from a sample has been discussed for awhile,3 but these systems were cobbled together by the user. Hyphenated systems can be looked at as three types: 1) sample modification systems, in which a sample in one instrument is somehow altered while it is measured (dynamic mechanical analysis [DMA] with a UV light source applied to the sample);4 2) evolved gas analysis, in which the gas released from the sample is examined (thermogravimetric analysis-infrared spectrometry [TG-IR], for example3); and 3) simultaneous analysis, where two or more methods are applied to the same sample (differential scanning calorimetry [DSC]-Raman5).
All three systems are becoming more widely available. No longer is it necessary for users to buy the parts and build their own TG-IR or TG-MS system. Systems can now be supplied that are installed like a GC-MS. In addition, evolved gas analysis (EGA) and simultaneous analysis systems are becoming available that greatly improve our ability to understand the problems of modern analysis. Two examples are TG-GC-MS and DSC-Raman.
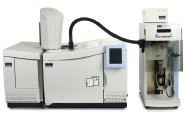
Figure 1 The Pyris 1 TGA couples to the Clarus 600 C GCMS (both from PerkinElmer, Shelton, CT) using a temperature controlled transfer line.
Both TG-IR and TG-MS6 have the advantage of being real-time methods, but they also have the same weaknesses. Because they are real time, both techniques show what has evolved from a sample in the thermogravimetric analyzer (TGA) at a specific time or temperature. However, in many cases, a complex mixture of products is released or generated at the same time. This can make identification difficult, because overlapping peaks or mass ranges confuse the issue, and very low concentrations of materials can be missed. This becomes important with issues like leachables in food or drug packaging. Coupling a TGA to a GC-MS (Figure 1) can allow very low levels of materials to be trapped and isolated, and components to be identified in very complex mixtures.
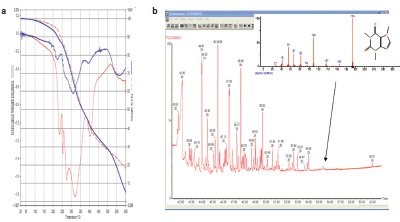
Figure - 2 a) The TGA curves for two types of coffee beans. Coffee beans can often be sorted by region of production by the derivative curve of the TGA. The peak in the GC scan in (b) corresponds to diethylphthalate as identified by MS.
An example of this can be seen with gases evolved from a green coffee bean on heating in the TGA.7 Burning beans of various types gives distinctive fingerprints in the TGA derivative, but IR or MS of the evolved gases provides very complex results. Analyzing a sample of green coffee beans stored in plastic containers in the TG-GC-MS and trapping the volatized materials on a Carbopak C™ filled precolumn (Supelco, Bellefonte, PA) show clear evidence of low levels of a diethylphthalate in the sample that is not seen in beans stored in metal (Figure 2).
Another example is the combustion of switchgrass, a potential biofuel. When switchgrass is burned in the TGA, both TG-IR and TG-MS show very complex mixtures of acids and alcohols in the off-gas. The mixtures are complicated enough that identification of the compounds is nearly impossible. Using a TGGC- MS system with a cooled furnace and a Swafer™ switching device (PerkinElmer), the gases resulting from the major burn of the material were collected on the head of a thick film polar wax column and then run.8 Results clearly show separation of the material and identification of specific materials such as formic acid (Figure 3).
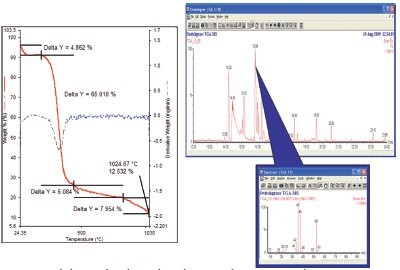
Figure 3 - The burning of switchgrass releases the majority of its components at about 400 °C, as seen in the TGA run. The GC-MS on the off-gas allows identification of small amounts of material like the formic acid seen here.
Simultaneous analysis: DSC-Raman
Differential scanning calorimetery is a powerful technique for studying transitions in materials from polymers to foods to pharmaceuticals, but the information is often incomplete in that structural or chemical information is inferred from the thermogram. For example, DSC allows users to see the transitions between crystalline forms in a drug or a food, but the forms must be determined by another method. Similarly, DSC can provide the energy and temperature of a cure that occurs by either heating or photoinitiation, but other information, such as the degree of consumption of the initiator as a function of cure, must be inferred.
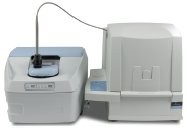
Figure 4 - The RamanStation 400 connects to the DSC 8500 (both from PerkinElmer) using a three-axis positioning adapter with optics to allow precise positioning of the Raman probe over the sample.
A simultaneous technique like DSC-NIR (near-infrared) or DSC-Raman solves these problems. In Raman spectroscopy, it is easy to track a band associated with a specific bond, such as the sulfur bond in an epoxy initiator, so that DSC-Raman can be used to track both the degree of cure from the enthalpy change as well as the disappearance of a bond associated with the initiator. However, one of the great strengths of DSC-Raman (Figure 4) is that a spectroscopist is able to determine structural information from the spectra. For example, in semicrystalline polymer, where the material exists in mixtures of crystalline and amorphous forms, the ability to understand crystallinity is an obvious advantage. Semicrystalline and crystalline polymers are of great economic importance, and understanding their behavior is critical. For the case of polyethylene (PE) in a series of isothermal studies,9 the samples of a “good” and “bad” material were used. Both materials were blown films used as bags. Bags made from the “bad” material failed under mechanical testing, while the “good” material produced an acceptable product. Samples were heated to above the melt as before, but then cooled at 200 ºC/min to a temperature at which polyethylene is known to recrystallize. The Raman spectrometer can collect data during the rapid heating of the material to the melt, although the fast heating will limit the number of spectra collected, and then on both the cooling and isothermal hold stages. After this experiment, the data are more conclusive in the Raman and in the DSC.