Arterial blood gas (ABG) analysis consists of three separate measurements—pH, pCO2, and pO2, but depending on the platform may also include calculated values for bicarbonate (HCO3), base excess (BE), total CO2 (TCO2), and blood oxygen saturation (sO2). Together, these measurements are evaluated to assess acid–base status, ventilation, and arterial oxygenation. Though arterial needlesticks, as required by ABG platforms, are routine in many hospital departments, the procedure can result in patient discomfort and serious adverse events such as arterial injury, thrombosis or embolization, hematoma, aneurysm formation, and reflex sympathetic dystrophy.1–4 Also problematic is the risk of needlestick to the health-care provider. In contrast, sampling of venous blood gases is usually less invasive, less painful, and more convenient. Researchers are currently exploring venous blood gas analysis, in conjunction with noninvasive pulse oxymetry measurements of arterial oxygen saturation (SpO2), as a comparable surrogate method for assessing patient respiratory function and establishing acid–base status.5–7
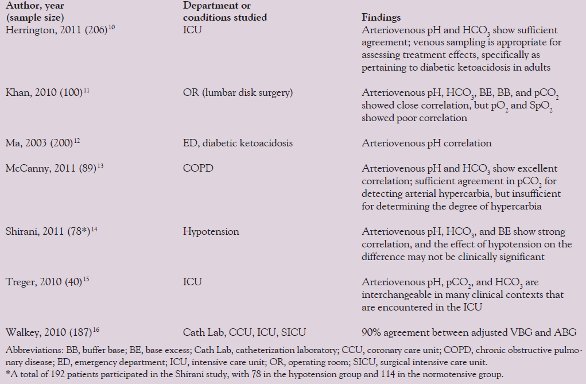
Table 1 - Summary of comparison research on VBG and ABG analysis
The push for minimally invasive blood gas sample collection is coupled with platform miniaturization and simplification. The fundamental advantage of point-of-care (POC) testing is the rapid acquisition of laboratory data at or near the site of patient care. Portable blood gas devices are increasingly being used to direct therapy in multiple hospital and prehospital settings.
This article describes the biosensor principles and clinical utility of blood gas analysis, discusses the possible surrogate method of venous blood gas analysis, and highlights the impact of point-of-care blood gas analyzers.
Measurement principles and clinical utility pH
The pH electrode measures the potential difference between the pH sensitive glass electrode (measuring electrode) and the reference electrode that has a known stable pH. This potential difference is generated by hydrogen ions (H+) causing the glass electrode to conduct a positive charge into the ionic solution inside the measuring electrode. By measuring the voltage across the two electrodes, the pH can be determined using the Nernst equation.8 The Nernst equation reveals pH level dependence on temperature. Many pH measurement instruments control for temperature using a water bath at 37 °C, or perform a temperature correction.
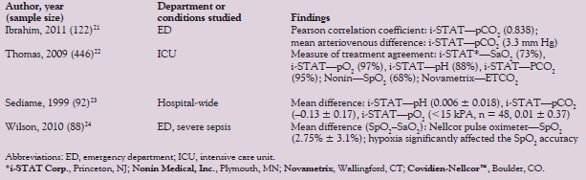
Table 2 - Summary of comparison research on POC and laboratory ABG analyzers
When determining the acid–base status of a patient, a pH measurement coupled with electrolytes and other clinical data can be instrumental in the diagnosis of a range of disorders, including respiratory acidosis, metabolic acidosis, and alkalosis. The human body must maintain a pH of 7.35–7.45. Elevated blood CO2 will increase the carbonic acid concentration and lower the pH. The kidneys are responsible for maintaining a 20:1 ratio of bicarb-to-carbonic acid ratio to buffer acidosis. The Henderson-Hasselbalch equation shows the relationship between blood pH and the bicarb/carbonic acid concentration.9
The pCO2 electrode (Severinghaus electrode) is similar to the pH electrode in that it measures hydrogen ions. Carbon dioxide in the blood sample passes through a gas-permeable membrane and reacts with a bicarbonate solution, generating a proportional hydrogen ion concentration.8 Blood pCO2 test samples must be collected anaerobically and tested shortly thereafter to minimize errors associated with time delay. Any air bubbles must be evacuated immediately to minimize the effect on the pCO2 (decrease) or pO2 (toward 150 mm Hg) in the sample.
Arterial pCO2 levels in relation to carbon dioxide production as a result of cellular metabolism are an indicator of adequate alveolar ventilation. Hence, pCO2 is a good indicator of ventilatory function. Under normal conditions a rise in pCO2 will trigger an increase in ventilation to restore the baseline pCO2. Increased pCO2 may be caused by neuromuscular disease or injury, cardiopulmonary arrest, oxygen-induced hypoventilation, or sedative overdose. Depending on the cause, intervention involves mechanical ventilation or sedative antagonists. Hyperventilation can cause the pCO2 to decrease and may result from pain, anxiety, or hypoxia.9
The pO2 electrode (Clark electrode) measures the pO2 amperometrically. Oxygen from the blood sample diffuses across a selectively permeable membrane where it is reduced at the cathode of a polarographic electrode. The reaction produces a measurable current that is proportional to the sample pO2. If a time delay of more than 10 min is expected, the sample must be immersed in an ice bath before testing. At room temperature, oxygen will continue to be consumed by leukocytes and platelets, causing a significant drop in pO2 over time.8
Low arterial oxygen content compromises oxygen delivery to all aerobic, metabolically active tissues, and critical tissue hypoxia may occur. The central nervous system and the heart are the sites most sensitive to oxygen deprivation. Coupled with attention to hemoglobin concentration and cardiac output, supplemental oxygen therapy may be administered.9
Historically, arterial blood has been the preferred sample type for blood gas analysis. This painful procedure may have rare, yet serious, complications involving vascular injury or occlusion and infection. The methods for collection of arterial samples expose staff to risk of needlestick injury.1–4
Multiple authors have suggested that anaerobically taken venous blood gas (VBG) analysis can replace arterial analysis for select patient populations and blood gas target analytes (i.e., pH, pCO2, bicarbonate, and base excess). Naturally, pO2 measured in venous blood will not be comparable to arterial, and many researchers have demonstrated supplementing venous blood gas analysis with pulse oximetry measurements of oxygen saturation (SpO2). Table 1 outlines published evidence in the study of arteriovenous agreement.10–16 Additionally, the cost-effectiveness of venous blood substitution has been found to be significant in hospital departments where >2000 arterial punctures per year are performed.17
There are still multiple questions as to when it would be appropriate to substitute venous for arterial blood in blood gas analysis. The data are inconclusive for non-normotensive patients, though several small studies have attempted to answer this question.14,18 Additonally, there are no established clinically acceptable limits of arteriovenous agreement for blood gas analytes. A statistically significant deviation may not be clinically relevant.
POC testing using blood gas analyzers
The conventional central laboratory can only give historical values of patient acid–base and ventilation status, whereas a point-of-care blood gas analyzer offers rapid, portable ABG at the point of need. Their ease of use, portability, and short turnaround time make POC ABG devices a valuable tool for managing patient oxygenation and ventilation in multiple clinical settings, including the prehospital,19 intensive care unit,20 and emergency department.21 Additionally, portable noninvasive bedside monitoring devices, such as pulse oximetry and end-tidal CO2 (ETCO2) detectors, can aid in blood gas analysis.
The advantages of POC ABG technologies are clear. However, the interchangeability of results with gold standard benchtop laboratory ABG remains in question (Table 2).22–24 Comparing regression scatter plots with prediction limits and calculated Pearson correlation coefficients (R2) between the POC ABG and benchtop ABG may not be sufficient to determine the equivalence of the two clinical measurements. In determining the limits of agreement, comparing one device to another over a range of measurements can be achieved using the Bland-Altman methods.25,26 Ultimately, defined treatments are governed by specific protocols. A measure of treatment agreement can give the clinician an idea of the frequency with which the protocol-driven treatment based on POC measurements agrees with the treatments governed by the gold standard benchtop measurements. Understanding the strengths and weakness of statistical tests used to compare different methods of measurement is critical to the interpretation and successful integration of POC technologies.
Conclusion
Whether determining the interchangeability of venous for arterial blood, or the use of POC in place of benchtop ABG devices, the limits of agreement are highly dependent on the clinical boundaries established by individual physicians. Widening or narrowing the clinical boundaries on measurement tolerance can affect whether a surrogate method is suitably equivalent to the gold standard regardless of the apparent statistical correlation or distinction. That said, POC testing cannot be an excuse for the manufacture of less accurate clinical measurement devices.
References
- Berger, A. Brachial artery puncture: the need for caution. J. Fam. Pract.1989, 26, 720–1.
- Gillies, I.D.; Morgan, M. et al. The nature and incidence of complication of peripheral arterial puncture. Anaesthesia1979, 34, 506–9.
- Giner, J.; Casan, P. et al. Pain during arterial puncture. Chest1996, 110, 1443–5.
- McCready, R.A.; Hyde, G.L. et al. Brachial artery puncture: a definite risk to the hand. South Med. J.1984, 77, 786–9.
- Rees, S.E.; Toftegaard, M. et al. A method for calculation of arterial acid–base and blood gas status from measurements in peripheral venous blood. Comput. Meth. Programs Biomed.2006, 81, 18–25.
- Rees, S.E.; Hansen, A. et al. Converting venous acid–base and oxygen status to arterial in patients with lung disease. Eur. Respir. J.2009, 33, 1141–7.
- Toftegaard, M.; Rees, S.E. et al. Evaluation of a method for converting venous values of acid–base and oxygenation status to arterial values. Emerg. Med. J.2009, 26, 268–72.
- Peura, R. Chemical biosensors. In: Medical Instrumentation Application and Design, 4th ed.; Webster, J., Ed.; John Wiley & Sons: Madison, WI, 2000; pp 449–7.
- Turlock, E.P. Arterial blood gases. In: Clinical Methods: The History, Physical, and Laboratory Examinations, 3rd ed.; Walker, H.K.; Hall, W.D. et al., Eds.; Butterworths: Boston, MA, 1990; pp 254–7.
- Herrington, W.G.; Nye, H.J. et al. Are arterial and venous samples clinically equivalent for the estimation of pH, serum bicarbonate and potassium concentration in critically ill patients? Diabet. Med.2012, 29, 32–5 [E-pub ahead of print].
- Khan, Z.H.; Samadi, S. et al. Prospective study to determine possible correlation between arterial and venous blood gas values. Acta Anaesthesiol. Taiwan2010, 48, 136–9.
- Ma, Oj.; Rush, M.D. et al. Arterial blood gas results rarely influence emergency physician management of patients with suspected diabetic ketoacidosis. Acad. Emerg. Med.2003, 10, 836–41.
- McCanny, P.; Bennett, K. et al. Venous vs arterial blood gases in the assessment of patients presenting with an exacerbation of chronic obstructive pulmonary disease. Am. J. Emerg. Med.2011 [E-pub ahead of print].
- Shirani, F.; Salehi, R. et al. The effects of hypotension on differences between the results of simultaneous venous and arterial blood gas analysis. J. Res. Med. Sci.2011, 16, 188–94.
- Treger, R.; Pirouz, S. et al. Agreement between central venous and arterial blood gas measurements in the intensive care unit. Clin. J. Am. Soc. Nephrol.2010, 5, 390–4.
- Walkey, A.J.; Farber, H.W. et al. The accuracy of the central venous blood gas for acid–base monitoring. J. Intens. Care Med.2010, 25, 104–10.
- Oddershede, L.; Petersen, S.S. et al. The cost-effectiveness of venous-converted acid–base and blood gas status in pulmonary medical departments. ClinicoEconomics Outcomes Research2011, 3, 1–7.
- Yildizdas, D.; Yapicioglu, H. et al. Correlation of simultaneously obtained capillary, venous, and arterial blood gases of patients in a paediatric intensive care unit. Arch. Dis. Child.2004, 89, 176–80.
- Jousi, M.; Reitala, J. et al. The role of pre-hospital blood gas analysis in trauma resuscitation. World J. Emerg. Surg.2010, 5, 10.
- Jain, A.; Subhan, I. et al. Comparison of the point-of-care blood gas analyzer versus the laboratory auto analyzer for the measurement of electrolytes. Int. J. Emerg. Med.2009, 2, 117–20.
- Ibrahim, I.; Ooi, S.B. et al. Point-of-care bedside gas analyzer: limited use of venous pCO2 in emergency patients. J. Emer. Med.2011, 41, 117–23.
- Thomas, F.O.; Hoffman, T.L. et al. The measure of treatment agreement between portable and laboratory blood gas measurements in guiding protocol-driven ventilator management. Trauma2009, 67, 303–14.
- Sediame, S.; Zehar-Lancner, F. et al. Accuracy of the i-STAT bedside blood gas analysis. Eur. Respir. J.1999, 14, 214–7.
- Wilson, B.J.; Cowan, H.J. et al. The accuracy of pulse oximetry in emergency department patients with severe sepsis and septic shock: a retrospective cohort study. BMC Emerg. Med.2010, 10, 9.
- Bland, J.M.; Altman, D.G. Applying the right statistics: analysis of measurement studies. Ultrasound Obstet. Gynecol.2003, 22, 85–93.
- Bland, J.M.; Altman, D.G. Measuring agreement in method comparison studies. Stat. Methods Med. Res.1999, 8, 135–60.
T. Keith Brock, BS, is a Contributing Writer, American Laboratory/Labcompare; e-mail: [email protected].