The pharmaceutical industry depends on testing and evaluation of novel compounds in a wide range of chemical space to feed its pipelines. Part 1 of this two-part series discussed how important it is for scientists to be able to rely on the integrity of hit-to-lead candidate molecules (hit = positive result). Mistakes happen, however, and several examples from blogs and journal reports to illustrate that fact were cited.1–3 Also covered were the consequences and scientific frustration that can be caused by errant molecules in high-throughput screening (HTS) libraries, and the ways in which automated NMR analysis has been used together with LC-MS and HPLC in a multidisciplinary fashion to provide automated review and detection of potential compound submission errors. Part 2 will cover the financial aspects of employing a systems approach to detect and report potential structural errors going into these libraries and whether their installation and implementation can be justified. Of particular focus are compounds synthesized for hit-to-lead optimization with target purity requirements set to 95% (and therefore more amenable to automated NMR analysis and interpretation).
Combined 1-D proton and HSQC NMR verification
The basic work flow of the automated NMR verification system detailed in Part 1 incorporates use of the 1-D proton combined with the 2-D heteronuclear single quantum coherence (HSQC) experiment.4,5 The key aspect is that structure verification functions are completely automated and run in the background. These functions are triggered automatically upon completion of compound registration. The background processes make use of NMR Expert, Automation Server, and C+H NMR predictors from the version 12 suite of applications (ACD/Labs, Toronto, Ontario, Canada).6
Table 1 - Structure errors found in commercial compounds purchased for benchmarking studies
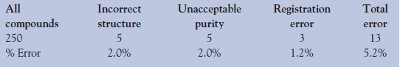
Examination of 250 commercial compounds with the automated analysis of the HSQC experiment was used to define benchmark results for the NMR verification system. Using positive and negative controls (correct and incorrect structures, each evaluated against the same set of experimental data), the authors found that they could reliably review compound sets with this technique to identify 78% of errant molecules (22% false positives). Analysis of the commercial reference compounds resulted in identification of several errors (Table 1) and allows for extrapolation of useful error rate criteria. Several causes of the structural errors in the benchmark compounds were identified as a result of the failing verification scores, which precipitated the need for deeper analysis.
Financial analysis of structure verification
The automated structure verification system has conservatively identified error rates between 1% and 2% of submitted compounds. These incorrect entries required administrative correction, structure elucidation, or withdrawal. In order to perform a financial analysis of the system, cost can be attributed to these errors as they relate to employee and associated consumables cost of synthesizing and testing incorrect compounds. The cost of an employee and the incremental costs of production are commonly referred to as the cost of a full-time equivalent (FTE). Current industry-standard FTE costs in the U.S. are approx. $250,000 per researcher per year. This is a conservative figure, since historically FTE rates in the U.S. and Western Europe have been as high as $325,000 per researcher per year.7,8 The cost of associated biology and HTS resources could also be included, but the authors found this unnecessary to demonstrate the return generated by the system; therefore, for simplicity, only chemistry-related FTEs and costs of analysis are discussed below.
Replication and resynthesis costs
Pharmaceutical companies engaged in small-molecule drug discovery use libraries comprising hundreds of thousands to millions of compounds for screening against targets. From a purely statistical perspective, the cost impact of an individual compound tends to be considered very low, due to the requirement that a compound produce a hit from a primary screen against the target protein. A subset of hit compounds often fails to reproduce positive results upon subsequent confirmation testing. This can be due to multiple sources of possible error, including compound degradation, improper replication, and accidental resupply with the wrong compound. If the negative confirmatory assay only consumes inventory from the original submission, no additional chemistry resources are wasted. However, if the compound repeats a positive result in the confirmatory assay, a resynthesis will very likely ensue. Assuming the correct compound is then produced, subsequent testing will not likely continue to produce positive confirmations, since the compound being tested will be what the original compound was intended to be and not what it actually was in the well of the HTS plate. The time spent for resynthesis represents a large relative cost of such a negative confirmation process, but occurs at a low rate since hits represent a small percentage of the library, and potential errant compounds are again a small percentage of the hits. Therefore, in the interest of simplicity, direct cost considerations of this negative process will be eliminated, despite the fact that these considerations do represent a peripheral benefit of the automated NMR verification system.
Pharmacology costs
The worst-case scenario for a discovery program would be to take the above-stated process one step further. Assuming the original errant compound hit in the primary screen and confirmed positively, the cost of the in vitro and in vivo pharmacology testing of the resynthesized, and now correct, compound will be incurred with looming negative results. The elimination of errant structures would analogously result in the benefit of not having wasted these resources. Similar to the cost of resynthesis, wasted pharmacology resources will occur at a low rate of frequency since errant compounds more typically do not produce desirable biochemical results. Their potential exclusion, due to automated structure verification by NMR, is a significant peripheral benefit of the system, but this benefit will be excluded from the financial analysis due to its low statistical rate of occurrence.
Simple error cost (SEC) model
A simplified model comparing the cost of errors to the cost of the system is a good place to start. The model is simple and conservative and is intended to identify if powerful and compelling arguments can be made to justify budgetary approval of an automated NMR verification system. The financial impact of errors is determined by focusing on the entire chemistry organization rather than only on the cost of individual chemists or individual errant molecules.
If the industry-standard FTE cost per chemist of $250,000 is used for all compounds produced, the gross cost for errors can be extrapolated to each chemist based on the authors’ experienced error rate. At a 1% error rate, an organization will incur $2500 in errors per chemist per year. At a 2% error rate, this cost grows to $5000 per chemist per year. It is revealing to note that depending on the error rate in an organization, it is not necessary to catch all erroneous compounds. It is sufficient to meet payoff even with a partial solution if this results in identification and correction of 1–2% of submitted molecules being modified or corrected.
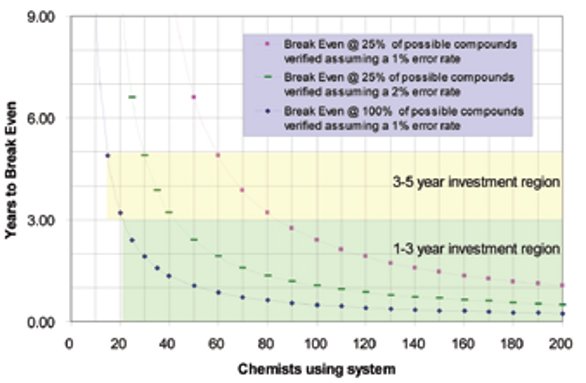
Figure 1 - Time in years to break even on investment based on number of chemists on staff.
Assuming an initial cost of implementation of approx. $117,000 ($75,000 for a perpetual license and $42,000 in FTE resources for integration), it is easy to see that as organizations scale in size, significant implementation benefits are achieved as the break-even point is more rapidly approached. Simply stated, an organization with 20 chemists and a 2% error rate will reach break-even status in one year (not shown). Similarly, for an organization with 50 chemists with a 1% error rate, a one-year break-even status will be reached (Figure 1). Since most large pharmaceutical companies have chemistry research units ranging from at least 50 to more than 200 medicinal chemists, implementation of such systems seems logical and scientifically compelling. Although in the authors’ view this calculation is conservative, rational, and logically defended when a purchase request for an automated NMR structure verification system has to be justified, it may be considered too simple and crude. Therefore, a more thorough return on investment (ROI) analysis has been performed.
ROI model
This model begins with the same total cost per chemist of $250,000 per year and therefore an error cost to the organization of $2500 per year per each % error. A conservative 1% error rate (as supported by Table 1) will be assumed for this example; however, the system will not catch all errors. Based on the authors’ experience (discussed further in the following section), the system can be relied upon to correctly identify approx. 78% of errors it is challenged with. The resulting cost savings per chemist is therefore reduced to $1950 per year. For this model, an initial cost of implementing the system of approx. $117,000 will be assumed ($75,000 for a perpetual license and $42,000 in FTE resources for integration: ~one employee for two months). Additionally, an annual maintenance fee of 18–20% of the perpetual license cost, or $15,000, will be incurred. Finally, a 10% hurdle/discount rate for the project will be assumed. Performing the ROI calculation for an organization with 50 chemists over a five-year period, and analyzing only 50% of possible compounds synthesized and submitted (the compound test rate), yields an ROI of 41%. If the investment is also burdened with opportunity cost, meaning it will be assumed that 10% has been earned on the funds invested elsewhere had they not been put toward this particular project, the investment yields 24%. This figure is derived using standard accounting internal rate of return calculations. The ROI model is particularly useful in smaller companies to demonstrate the real impact of choosing one investment over other competing interests. Unlike the SEC model, the ROI model yields change dramatically depending on the size of the chemistry organization. An organization of only 20 chemists must analyze >70% of synthesized compounds in order to yield an 11% ROI, not including opportunity cost. For 20 chemists, the project has a negative ROI when opportunity costs are included, unless >92% of compounds synthesized are autoverified against an HSQC data set.
Therefore, the ROI model tells us, and those evaluating this type of project, what we truly need to understand. Whether or not to engage in this project essentially relies on three factors: the size of the chemistry organization, the percentage of submitted compounds that will be autoverified, and the speed with which the system can be implemented. Consistent with the SEC model, those with larger chemistry organizations should be implementing this system. Those with smaller groups, or inadequate resources to implement the system in a timely manner, might want to consider other projects.
A basic calculation that can be used for justification is the determination of the break-even point in years, which can be calculated according to Eq. (1):
Years to break even = implementation
cost/(value of recovered compounds/
year – maintenance costs/year)
(1)
Where value of recovered compounds/ year = FTE cost/year × compound error rate × number of chemists × compound test rate, or essentially the cost of synthesis for the incorrect compounds for one year for an organization (compound test rate is the percentage of all submitted compounds actually tested by the autoverification system).
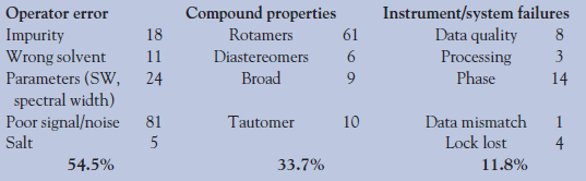
Table 2 - Causes for 255 invalid data sets in 2610 runs = 10% overall
The error rate of 1%, graphed in Figure 1, is somewhat conservative (as supported by figures from Table 1); however, the actual working error rate is subject to several factors and thus a somewhat simplified version was used. The effective/working error rate is a factor of:
- The actual incorrect structures/compounds submitted as a result of either synthesis error or by an accidental or propagated administrative error at registration time.
- The proportion of incorrect structures that can be identified by the system, by definition the true-positive rate = 1 – false-positive rate. With a reported false-positive rate of 22% for commercially available, pharmaceutical-like reference compounds, that results in a 78% true-negative identification rate. This performance measure continues to improve as prediction source databases expand and become more accurate and as the verification and assignment algorithms themselves improve.6,9,10
- The number of compounds submitted that would be considered valid for the NMR analysis. Data that exhibit rotameric, diastereoisomeric, or tautomeric mixtures would be invalid for analysis (this has been discussed previously1). The authors experienced a typical valid data rate of 90% when experiments were run in an openaccess environment by the medicinal chemists. The current cumulative breakdown of invalid compounds as a result of 2610 autoverifications is depicted in Table 2.
Thus, the “error rate” to plug in to the equation would be:
(Compound error rate) × (% of
valid NMR data) × (true negative ID rate),
or (compound error rate) × 0.90 × 0.78
(2)
Auxiliary benefits
Other aspects not taken into account are the peripheral benefits the system provides to the organization. While some of these may already exist in some organizations, they are essentially prerequisites and outcomes necessary to make such a system work. Some benefits may be, but are not limited to:
- Systematic archival of spectra that are retrievable by key elements of information such as notebook reference or chemist, etc.
- A spectral database with a compound structure-to-spectrum relationship, and all of the benefits associated with spectral databases such as peak list searching, etc.
- Automatically generated proposed assignments on molecules to aid chemists (Figure 2).
- Extracted coupling constants in chemistry journal format posted to proton spectra (Figure 2).
- Assigned spectra systematically added to the company’s proprietary prediction training database necessitated by use of novel chemotypes/scaffolds around the molecular space that is being used in order to improve NMR chemical shift predictions to users and for the system.
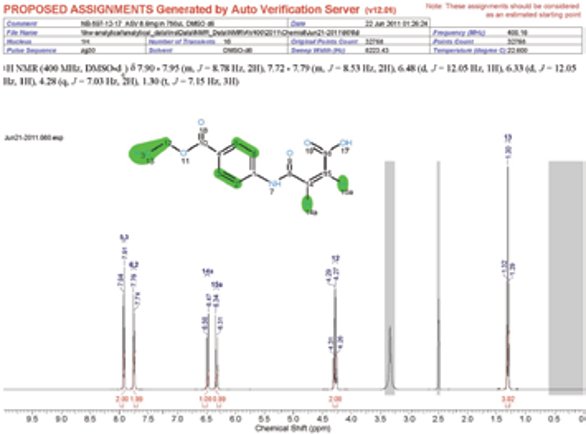
Figure 2 - Example assignment report with journal-format coupling information.
Conclusion
Integration of automated structure verification using a multidisciplinary inspection by NMR, LC-MS, and HPLC meets the criteria for practical return on investment. Given the conservative estimates used to evaluate the potential ROI of an automated verification system that will leverage data collected on NMR spectrometers, it should be evident that payback is achievable for modest-size organizations from biotech through Big Pharma in which 30 or more chemists are engaged in drug discovery. Managers and financial planners typically look to achieve ROI in periods of 3–5 years, and this is clearly achievable even if only chemistry costs are taken into consideration. Under typical operating conditions in which a portion of submitted compounds are evaluated (~25%) and an error rate of between 1 and 2% of errant compounds are identified, ROI can still be achieved in organizations with 40–60 chemists (Figure 1). However, if one considers the peripheral benefits achieved in addition to the more effective use of biology resources resulting from enhanced compound integrity, it makes an even stronger argument in favor of implementation of such systems for organizations with 30 or fewer chemists.
References
- Elyashberg, M.; Williams, A.J. et al. Nat. Prod. Rep.2010, 27, 1296–1328.
- http://pipeline.corante.com/archives/2010/05/24/great_moments_in_ heterocyclic_chemistry.php.
- Caridha, D.; Kathcart, A.K. et al. Bioorg. Med. Chem. Lett. Jul 2010, 20(13), 3863–7.
- Bodenhausen, G.; Ruben, D. Chem. Phys. Lett. 1980, 69, 185.
- Davis, A.L.; Keeler, J. et al. J.Magn. Reson. 1992,98, 207.
- Golotvin, S.S.; Vodopianov, E. et al. Magn. Reson. Chem. 2007, 45, 803–13.
- Outsourcing Jul/Aug 2007, pp 6–7 (http://endotherm-lsm.com/downloads_downloads/Art_Endotherm%5B1%5D.pdf).
- McCoy, M. Chem. Eng. News 2005, 83(44), 14–18.
- Keyes, P.; Hernandez, G. et al. Magn. Reson. Chem. 2009, 47, 38–52.
- Yegor, D.; Smurnyy, K.A. et al. J. Chem. Inf. Model.2008, 48, 128–34.
Philip Keyes is Director, Site Operations and Analytical Chemistry, and Michael Messinger is Director, R&D Finance, Lexicon Pharmaceuticals, 350 Carter Rd., Princeton, NJ 08540, U.S.A.; tel.: 609-466-5596; fax: 609-466-3562; e-mail: [email protected]. Gonzalo Hernandez, Ph.D., is an NMR consultant at Vis Magnetica, Montevideo, Uruguay.