Historically, plate height as given by the Van Deemter equation has been used as the measure for separation efficiency in terms of contribution from the A, B, and C term versus linear velocity. Van Deemter theory tells us as you reduce the particle size of your stationary phase, the contribution from the A (Eddy Diffusion) and C (mass transfer) terms is reduced and the Van Deemter curve is flatter at higher linear velocities. The disadvantage of using smaller particle size is the increase in column backpressure. However, if higher backpressures can be tolerated by the HPLC, increasing flow rates do not cause a significant increase in band broadening, resulting in faster analysis time and higher sample throughput. Recent literature suggests that chromatographic efficiency is improved, though at linear velocities higher than suggested by Van Deemter theory.1
Maximizing peak capacity
Although chromatographic efficiency is traditionally described by Van Deemter theory, this theory, in a practical sense, is best used for isocratic and isothermal-based separations. Peak capacity is a more suitable measure of efficiency in gradient separation. Peak capacity is defined as the number of peaks that can be separated with defined resolution (for example, a resolution of 1) in a certain period of time for a given system (column length and particle size).
Prior to the development of ultrahigh-power liquid chromatography (UHPLC) systems, the upper pressure limits and flow rate ranges that could be tested were limited by the power range (flow rate and backpressure operating range) of currently available HPLC hardware. With the advent of UHPLC systems, the performance of the columns analyzed can be explored experimentally at these higher power ranges. As such, it would be of interest to test whether chromatographic efficiency improves at flow rates much higher than typically employed by most chromatographers. Also, it would be desirable to obtain an understanding of how column length, column temperature, and gradient length perform in terms of chromatographic efficiency as flow rate is increased.
Experimental
All separations were performed using an Agilent 1290 Infinity UHPLC system (Agilent Technologies, Palo Alto, CA) equipped with a binary pump (integrated degasser and 100 μL jet weaver gradient mixer), autosampler, thermostatted column compartment, and diode array detector (with low-dispersion 10-mm pathlength optofluidic waveguide flow cell, 1 μL dispersive volume). The data were analyzed using a Chemstation from Agilent. Three Agilent Zorbax SB-C18 Rapid Resolution HD columns (2.1 mm diam with 1.8-μm particle sizes, stable up to 1200 bar maximum pressure) of varying length (50, 100, and 150 mm), were chosen for the study. The mobile phase was selected as water (A) and acetonitrile (B), both containing 0.1% trifluoroacetic acid. The gradient was varied over 5, 10, and 15 min, each time starting at 5%B and ending at 95%B. The column temperature was varied from 30, 60 (tested for 100-mm column only), and 90 ºC, and the flow rate was varied from 30, 60 (tested for 100-mm column only), and 90% of maximum allowable system backpressure for each condition. The UV signal was monitored at 220 nm (4-nm bandwidth) with a reference of 600 nm (80-nm bandwidth). Peak capacities were calculated for each condition, in triplicate, using a mixture of small molecules (Glafenine, Labetalol, Dipyridamole, Hydrocortisone, Chrysin, and Disperse Yellow, available from Sigma Chemical Co., St. Louis, MO). Peak capacity was calculated by dividing the gradient time by the average peak width (six components averaged over three replicate injections) and adding one. Peak width was taken at half maximum and multiplied by 1.7 (or 4σ).
Results
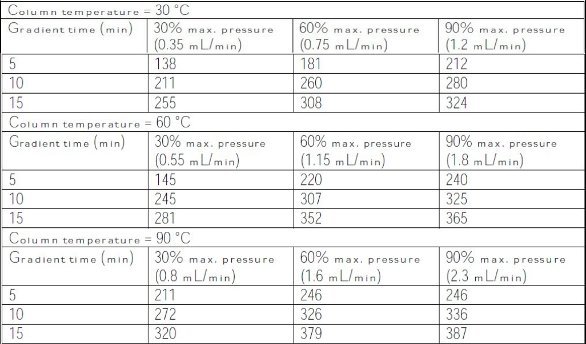
Table 1 - Peak capacities for the 100-mm-long column as a function of gradient time, percentage of maximum backpressure versus column temperature
Increased peak capacity and chromatographic efficiency
Peak capacities calculated for the 2.1 × 100 mm column as a function of gradient time and percentage of maximum allowable system backpressure versus column temperature are shown in Table 1. The table also includes the flow rates that were used in order to generate 30, 60, and 90% of the allowable system backpressure. The data indicate that the highest peak capacity (most efficient separation) is achieved at 90 °C, 90% max. pressure, 15-min gradient, while the lowest peak capacity (least efficient separation) is observed at 30 °C, 30% max. pressure, 5-min gradient. Peak capacity increases as flow rate and temperature increase for each gradient time, except for the 5-min gradient time at 90 °C, where the peak capacity stays the same as flow rate is increased from 60 to 90% of maximum allowable backpressure.
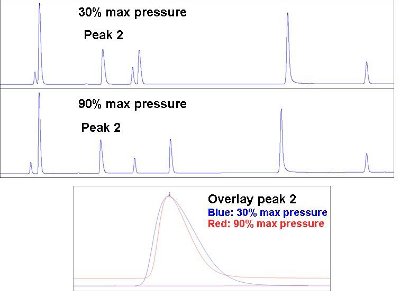
Figure 1 - Chromatography comparison of increasing the flow rate from 30 to 90% of maximum allowable backpressure for the 10 min gradient at 30 °C.
As an example, Figure 1 illustrates the improvement in chromatographic efficiency by a comparison of increasing the flow rate from 30 to 90% of maximum allowable backpressure for the 10-min gradient at 30 °C.
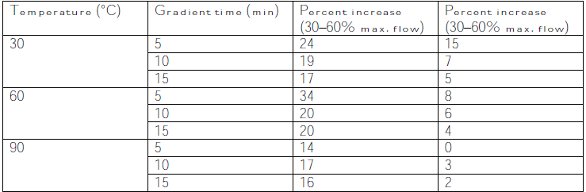
The data were also examined in a different way by calculating the percent increase in peak capacity as the flow rate was increased from both 30 to 60% and 60 to 90% of the maximum allowable backpressure. The results are shown in Table 2. These data indicate that most of the increase in peak capacity is gained as one increases flow from 30 to 60% of the maximum backpressure, although for the most part additional gains in peak capacity are achieved by generating flow rates at 90% of the maximum backpressure.
Table 2 - Peak capacity comparison in terms of percent increase as the flow rate is increased for the 100-mm column
For both the 50- and 150-mm-long columns, peak capacities were also shown to increase as flow rate increased (between 30 and 90% maximum allow backpressure) for each gradient time (5, 10, and 15 min) and temperature (between 30 and 90 °C). Additionally, as with the 100-mm-long column, both the 50- and 150-mm-long columns showed their highest peak capacity at 90 °C, 90% max. pressure, 15-min gradient, while the lowest peak capacity was observed at 30 °C, 30% max. pressure, 5-min gradient.
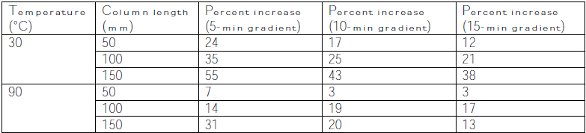
Table 3 - Peak capacity comparison in terms of percent increase as the column temperature increased
The gains in peak capacity (as a function of increasing flow rate) by changing column temperature are shown in Table 3. The gain is expressed in terms of the percent increase in peak capacity as the flow was increased from 30 to 90% of the maximum system backpressure. For each column length and gradient time, the percentage increases are largest at lower column temperatures. Since the percent increase in peak capacity at 90 °C is not as significant as at 30 °C, this can be interpreted to mean that for a given column and gradient time, the higher the column temperature, the higher peak capacities, and that increasing the flow rate one can better maximize peak capacity, although most of the peak capacity gain is achieved using increasing column temperature. Additionally, for a given gradient time, column temperature has a greater gain in peak capacity as the column length increases. The longer the column, the lower the possible flow rate can be at an equivalent percentage of system backpressure. Therefore, for longer columns, because one cannot achieve as many peak capacity gains by increasing flow rate, the majority of gain in peak capacity must be achieved using column temperature.
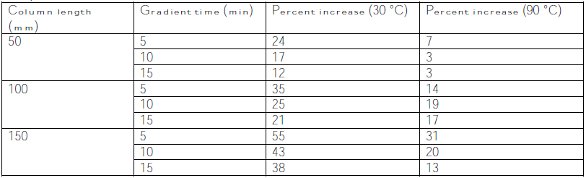
Table 4 - Peak capacity comparison in terms of percent increase as the gradient length increased
Similar to the discussion about column temperature, the gain in peak capacity (as a function of increasing flow rate) by increasing the gradient time can be compared, as shown in Table 4. Again, the gain is expressed in terms of the percent increase in peak capacity as the flow was increased from 30 to 90% of the maximum system backpressure. For each column length and temperature, the shorter gradient resulted in greater percentage increases in peak capacity, aside from increasing the gradient time from 10 to 15 min on the 50-mm column, where it stayed equal. Since the percent increase in peak capacity at longer gradient times becomes less significant, this can be interpreted to mean that for a given column length and temperature, the longer the gradient, the higher peak capacity and that increasing the flow rate one can better maximize peak capacity, with much of the peak capacity gain attributed to increasing the gradient time. Additionally, for each column temperature, the longer column has a greater gain in peak capacity as gradient time decreases. The longer the column, the lower the possible flow rate can be at an equivalent percentage of system backpressure. Thus, for longer columns, because one cannot achieve as much peak capacity gains by increasing flow rate, the majority of gain in peak capacity must be achieved using gradient time.