Sample preparation is often considered a means to an end. It is frequently overlooked by many researchers and poorly described in many published, peer-reviewed articles.1,2 Sample preparation may comprise multiple steps such as sample homogenization, extraction, filtration, preconcentration, hydrolysis, and derivatization.1–3 Seldomly is optimization of sample preparation well documented, and neither rationale for the selection of a particular extraction solvent/solvent mixture—hydrolysis or derivatization procedure and/or conditions for the analysis of phytochemicals from different plant matrices—is well justified.
These factors have contributed to wide variations in the analytical results. Different groups may appear to use the same procedures and obtain diverse results, since critical details, particularly in the sample preparation phase, are not well documented. More than two-thirds of the analysis time is spent on sample preparation, and approximately 30% of the analytical error stems from the sample preparation step.4,5 The objective of sample preparation is multifold: to eliminate or reduce potential interferences, to enhance the sensitivity of the analytical procedure by increasing the concentration of the analyte in the assay mixture, and sometimes to convert the analyte of interest to a more suitable form that can be easily separated and/or detected. Thus, optimizing the sample preparation procedure is crucial to the development of robust, reproducible, and accurate analytical procedures for the assay of both macro- and micronutrients.
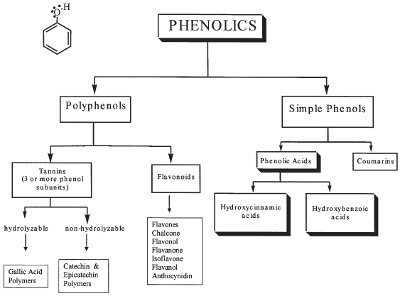
Figure 1 - Chemical classification of phenolic compounds.
Phenolic compounds are one of the important classes of bioactive phytochemicals that are ubiquitously distributed throughout the plant kingdom. These compounds are important constituents of some nutraceuticals/functional foods and are of considerable interest to scientists, manufacturers, and consumers. This is due to such beneficial effects as free radical scavengers and chelators of pro-oxidant metals, thus providing protection against certain types of cancers and other chronic diseases.6,7 Over 8000 phenolic compounds have been identified from different natural sources. All phenolic compounds possess at least one common structural moiety, a phenol (an aromatic ring having at least one hydroxyl group). As depicted in Figure 1, chemically phenolic compounds can be broadly classified into two major groups: simple phenols and polyphenols. Polyphenols can be further subdivided into two groups: flavonoids (flavones, isoflavones, anthocyanins, chalcones, flavonol, flavanones, etc.) and tannins (polymers of phenolic acids, catechins, or epicatechins). Simple phenols can be further divided into two classes: phenolic acids (cinnamic acid or benzoic acid and its derivatives) and coumarins.1,2
Phenolic compounds can be found as free aglycons or as conjugates with sugars, alkylated-sugar, and acids. Phenolic compounds can also exist as complexes with carbohydrates, proteins, or other cell components. Phenolic compounds are not homogeneously distributed in plants at the tissue, cellular, and subcellular levels. Soluble phenolics are usually found within the cell vacuoles, whereas insoluble phenolics are components of cell walls.1 The solubility of phenolic compounds is influenced by their chemical structure, degree of polymerization, interaction with other component of their matrix, particle size of the matrix, polarity of extraction solvent, extraction technique (sonication, stirring, percolation, wrist shaking, Soxhlet, supercritical fluid extraction, pressurized liquid extraction, Ankom batch extraction [ANKOM Technology, Macedon, NY], and microwave extraction), and conditions (time, temperature, pressure, inert nitrogen atmosphere). Since several thousand phenolic compounds with diverse structural configurations have been isolated from different natural resources, it is challenging and practically impossible to develop a single uniform extraction process for the optimum extraction of all phenolic compounds from every possible matrix. Hence, it is essential to optimize sample preparation procedures for the accurate estimation of phenolic compounds from a plant matrix.
Tea, for example, has been an important part of the human diet for centuries for a majority of the population and is consumed globally in large portions on a daily basis. Its appeal is for its taste, aroma, and lately its reported health benefits. Tea extracts have been shown to reduce the risk of certain forms of cancer and atherosclerosis. These beneficial properties of tea are generally considered to be associated with its high phenolic content. Different classes of phenolic compounds with wide variations in chemical structure and polarity have been isolated from tea. These compounds were identified as flavan-3-ols (epicatechin and its derivatives) and flavonols (quercetin, kaempferol, myricetin, and their conjugates) and phenolic acids (gallic acid, coumaric, caffeic acid, and their derivatives). Flavan-3-ols and their derivatives are present in lower amounts in black tea, where theaflavins and thearubigins are more common.8 A quick review of the methodology published in the literature for the extraction of phenolic compounds from tea revealed that a wide range of solvents and extraction conditions have been employed by different scientists. Researchers have used solvents such as water, aqueous methanol, acidified methanol, as well as aqueous acetone for the extraction of phenolic compounds. The solid-to-solvent ratio reported for green tea has varied between 1:5 and 1:200 (weight:solvent volume). The extraction temperature has ranged from 25 °C to 100 °C, whereas extraction times varied from 2–3 min to 3 hr. This example clearly demonstrates that sample preparation can be highly diverse, and critical details on sample extraction may either never be optimized and/or simply not be reported.
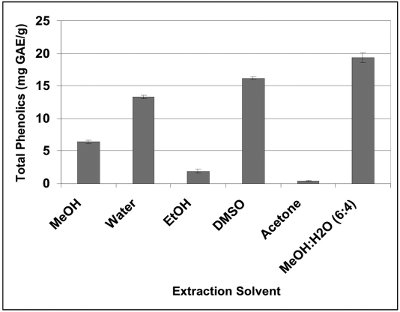
Figure 2 - Influence of solvent on extractability of total phenolics from black cohosh (Cimicifuga racemosa).
In a recent study on the optimization of the extraction of phenolics from black cohosh (Cimicifuga racemosa) in the author’s laboratory, it was observed that the amount of total phenolic extracted with different solvents varied significantly, as shown in Figure 2.2 When extractions were performed with neat solvent, the optimum yield of total phenolic was obtained with dimethyl sulfoxide (16.2 mg gallic acid equivalents [GAE]/g) and the lowest amount of total phenolics (1 mg GAE/g) was recovered with acetone. The yield of total phenolics extracted by other solvents (methanol, ethanol, and water) varied between the two extreme levels. In addition, the amount of total phenolics extracted with different proportions of MeOH:H2O solvent mixtures varied with the concentration of MeOH. Optimum yields of total phenolics as assayed by the colorimetric Folin-Ciocalteu assay9 were obtained with MeOH:H2O (60:40, % v/v).
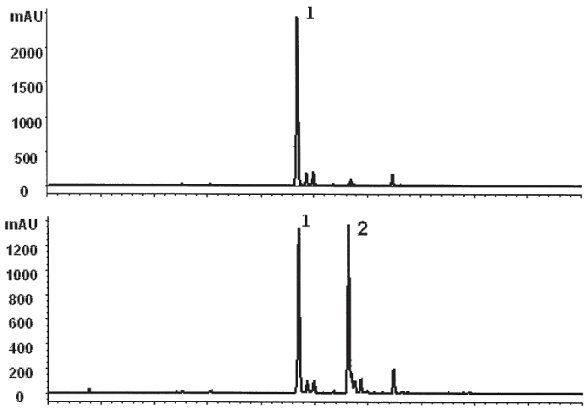
Figure 3 - HPLC profile of dried parsley flakes extracted with different solvent mixtures. a) EtOH:H2O, 70:30 (v/v), b) EtOH:H2O, 50:50 (v/v). Peaks 1 and 2 were identified as apigenin-7-apiosylglucoside (apiin) and apigenin-malonyl-apiosylglucoside (malonyl-apiin), respectively.
In another study, on extraction of phenolics from parsley flakes (Petroselinum crispum), it was observed that not only the amount of total phenolics varied, but also the composition of the phenolic profile changed significantly with a marginal change in the water:alcohol ratio.10 Apiin was only the major phenolic peak detected when parsley flakes were extracted with ethanol:water (70:30, % v/v). However, two major phenolic compounds (apiin and malonyl-apiin) were identified when extractions were performed with an ethanol:water (50:50, % v/v) solvent mixture (Figure 3). Thus, a marginal variation in the ethanol:water ratio caused significant changes in the phenolic profile and the amount of total phenolic compounds extracted from parsley flakes.
The process of sample preparation not only influences the assay of phenolic and other micronutirents but also macronutrients such as crude fat.3 Dried soybeans were ground and sieved to provide five particle size fractions (>1.4 mm, 1.0 mm, 0.6 mm, 0.3 mm, and >0.6 mm, <0.6 mm and >0.3 mm, <0.3 mm).