Chemotherapeuticals as feed additives were widely used in the European Union (EU) to prevent and control many diseases in food-producing animals.1 Authorization of the majority of these molecules was withdrawn by the EU legislation in recent years.
The aim of this work was the simultaneous determination of olaquindox, carbadox, nicarbazin, nitrofurantoin, nitrofurazone, furaltadone, furazolidone, nifursol, and ronidazole in feed samples by a monolithic column coupled with HPLC-DAD (diode array detection), in accordance with the 2000 Italian National Plan for Animal Alimentation Control (PNAA),2 which imposes the analysis of these chemotherapeuticals in feed.
Ronidazole (1-methyl-5-nitroimidazole-2-methanol carbamate) was used for the control of blackhead disease in poultry and for protection against protozoan and certain microbial infections in pigs. Ronidazole was deleted from annex I to Directive 70/524/EEC by Commission Directive 98/19/EC.3
Nitrofurans (nitrofurantoin (1-[[(5-nitro-2-furanyl)methylene] amino]-2,4-imidazolidinedione); nitrofurazone (2- [(5-nitro-2-furanyl)methylene]hydrazinecarboxamide); furaltadone (5-(4-morpholinylmethyl)-3-[[(5-nitro-2-furanyl)methylene]amino]-2-oxazolidinone); furazolidone (3-[[(5-nitro-2-furanyl)methylene]amino]-2-oxazolidinone); and nifursol (3,5-dinitro-2’-(5-nitrofurfurylidene) salicylohydrazide)) are antibacterial drugs often added to feed to stimulate growth and to prevent and control several bacterial and protozoan infections such as fowl cholera and coccidiosis.
Nitrofurans were banned antibiotics included in annex IV of Council Regulation 2377/1990,4 except nifursol, which was authorized in the EU until March 31, 2003. After this date, authorization was withdrawn as per Council Regulation (EC) 1756/2002.5
Carbadox (methyl-3-(2-quinoxalinylinylmethylene) carbazate-N1, N4-dioxide) is an antimicrobial drug that has been used as a feed additive for the prevention of swine dysentery and bacterial enteritis in young swine,6 and also as a growth promoter. Olaquindox (2-(N-2-hydroxyethylcarbamoyl)-3-methylquinoxaline-N1, N4-dioxide) is a synthetic compound that was used as a growth promoter in pigs. These two compounds were banned in the EU following Commission Regulation (EC) 2788/98.7 All of these molecule authorizations were withdrawn because their residues, at whatever limit, in foodstuffs of animal origin constitute a hazard to consumer health.
Nicarbazin is an equimolar complex of 4-4’-dinitrocarbanilide and 2-hydroxy-4,6-dimethylpyrimidine and is used as an anticoccidial in poultry and rabbits.
Nicarbazin is, at the moment, licensed as feed additive according to Regulation 1831/20038 at a prescribed concentration and for broilers and young chickens only. Any other use was forbidden according to Commission Regulation (EC) 2205/2001.9 Since the early 1950s, several analytical methods have been published for the determination of chemotherapeuticals in feed. These methods have employed thin layer chromatography,10 colorimetric determination,11 or HPLC either with UV or MS detection.12–15 None of the above methods can simultaneously detect all of the molecules considered in this work—an important task to prevent the presence of residues in food of animal origin and thus to protect the health of consumers.
This study reports on the use of a monolithic column for the determination of chemotherapeuticals in feed.
Experimental
Chemicals and solvents
Acetone (99.8%), dichloromethane (99.5%), methanol (99.9%), dimethylformamide (99.8%), and sodium acetate (99.5%) were of analytical reagent grade (Carlo Erba, Milan, Italy). Acetic acid (100%) was of analytical reagent grade (Prolabo, Paris, France). Acetonitrile (99.9%) was of HPLC grade (Carlo Erba).
Reagents, standard, and HPLC mobile phase were prepared with high-purity water obtained from a Milli-Q system (Millipore, Bedford, MA). LC mobile phase was filtered through a 0.45-μm Durapore membrane (Millipore). The purified samples were filtered through 17-mm 0.45-μm nylon filter prior to injection in the HPLC system. The Al-N SPE cartridges (1 g/6 mL) were supplied by IST (Mid Glamorgand, U.K.).
Apparatus
A rotary evaporator (Büchi, Flawil, Switzerland) and a nitrogen evaporation system with thermostated heating plate (Liebisch, Bielefeld, Germany) were used. The HPLC system comprised a P4000 quaternary pump, AS3000 autosampler equipped with a Rheodyne injector model 7125 (Cotati, CA), SCM1000 solvent degasser, and UV6000LP diode array detector (all from Thermo Electron, San José, CA [with the exception of the 7125 injector]).
Table 1 Gradient program used for HPLC separation

The HPLC column was a Chromolith SpeedROD RP-18e 50 × 4.6 mm i.d. with a Chromolith guard cartridge (all from Merck, Darmstadt, Germany). The column was maintained at 30 °C using a column oven.
HPLC eluent A was acetate buffer 0.05 M (pH 4.5) and HPLC eluent B was acetonitrile. The separation was accomplished in 6 min by gradient elution, as shown in Table 1. The flow rate was maintained at 5 mL min–1. The DAD was set at 320 nm for ronidazole and carbadox and 365 nm for nitrofurantoin, nitrofurazone, furaltadone, furazolidone, nifursol, olaquindox, and nicarbazin.
Standard solutions
Olaquindox and nitrofurazone were from MP Biomedicals (Irvine, CA); ronidazole, carbadox, and nicarbazin were purchased from Sigma (St. Louis, MO); nitrofurantoin, furazolidone, and furaltadone were from Riedel de Haën (Seelze, Germany); nifursol was purchased from Dr. Ehrenstorfer GmbH (Augsburg, Germany). Stock solutions were prepared in dimethylformamide at 1.0 mg mL–1. These solutions were stored at –20 °C (except nicarbazin, at +4 °C) for no longer than 3 months. Working standard solutions of 50.0, 25.0, 10.0, 5.0, 2.0, 1.0, 0.5, and 0.1 μg mL–1were prepared daily by serial dilution of the stock with MeOH/H2O (60:40, v/v).
Sample preparation
Five grams of ground feed was placed in a plastic bottle, and 50 mL of dichloromethane/acetone (1:1, v/v) solution was added. The bottle was capped tightly and shaken on a mechanical shaker for 1 hr. The solution was centrifuged at 3500 rpm for 15 min, and afterward 2 mL of the solution was taken and evaporated to dryness under a stream of nitrogen at 50 °C. The residue was then suspended in 1 mL of methanol/water (80:20, v/v) and cleaned up by solid-phase extraction (SPE).
A 1-mL aliquot of extract was purified on an Al-N SPE cartridge. The SPE cartridges were conditionedby 3 mL methanol and 5 mL methanol/water (80:20, v/v) and collected in a 10-mL tube. The molecules were eluted from the SPE cartridge by 4 mL of MeOH (60%) and 4 mL of MeOH (100%).
The purified extract was blown down to dryness under a stream of nitrogen at 50 °C, resuspended in 0.5 mL of MeOH (60%), and filtered on a nylon filter; 20 μL was injected into the HPLC system. For validation studies a blank chicken feed was spiked at 1, 2, and 5 mg kg–1 by addition of an appropriate volume of chemotherapeutical standard stock solution (5, 10, and 25 μL) to a 5-g feed sample. After the addition, the spiked feed samples were allowed to stand for 1 hr at room temperature in the dark before extraction.
Results and discussion
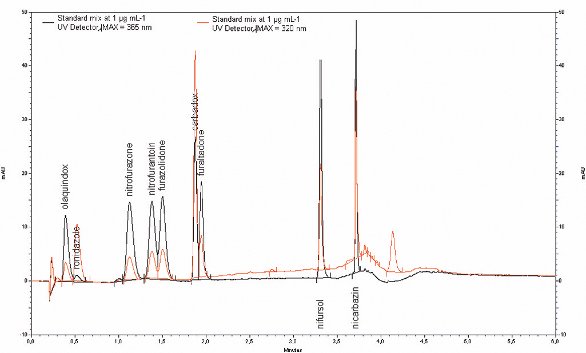
Figure 1 - Chromatogram of standard mixture (1 μg mL–1).
A chromatogram of a standard mixture is shown in Figure 1. The 365- and 320-nm traces are superimposed to show the different chromatographic response of the molecules at the two λmax used in the method to obtain maximum sensitivity. Moreover, the chromatogram shows the very short time required to achieve a very good separation using a monolithic column.
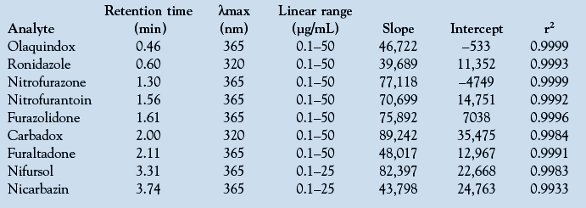
The linearity and regression study was performed at λmax for each molecule to increase performance. The high correlation coefficient (r2) values (all in excess of 0.998, except nicarbazin) indicate good correlation between chemotherapeutical concentration and peak areas. The results are seen in Table 2, which shows the linear regression data obtained by triplicate runs for each compound.
Table 2 - Linear regression data and squares of correlation coefficients for the standard curves
Once the method was developed, a blank chicken feed was spiked at three different levels (1, 2, and 5 mg kg–1) and six samples were run for each experiment. Figure 2 shows the superimposed chromatograms of a blank feed and the same feed spiked at 1 mg kg–1. It is evident that no interference peaks are present around the retention times of the molecules investigated in this work. According to the 2005 PNAA,16 other feeds were investigated (calf and pig) with a chromatographic profile very similar to that shown by the poultry feed used for validation purposes.
Average recoveries and repeatabilities were investigated by blank feed fortification of all the molecules investigated in the range of 1–5 mg kg–1, running six samples for each experiment. Recoveries, between 53 and 98% with coefficients of variation (CV) all below 10%, were obtained. Both the recovery and within-day precision (repeatability) were very satisfactory for a multiresidue method.

Figure 2 - Chromatogram of blank and spiked chicken feed.
The limit of detection (LOD) was calculated on the basis of the results for six replicates of the feed sample spiked at 1 mg kg–1 using the previously published formula:17
LOD = t(0.99) × SD
where t(0.99) is the student’s 1-tailed t-value at 99% confidence level and with (n-1) degrees of freedom, and SD is the standard deviation of the replicates analysis.
The limit of quantification (LOQ) was taken as the smallest concentration of analyte that is measured with a defined degree of precision (repeatability). Precision was considered acceptable when its CV values were<10%; hence, the LOQ was determined to be 1 mg kg–1 for all the substances investigated. The validation data are listed in Table 3.
Table 3 - LOD, average recoveries (CV), and repeatabilities of nine chemotherapeuticals at three levels of spiking*

Conclusion
The method proposed is suitable for analyzing chemotherapeuticals down to 1 mg kg–1, which is an acceptable level for ensuring consumer protection. The main advantage of this novel method is that it reduces the HPLC separation time significantly and, because of this time reduction, the method is useful for laboratories that need to analyze a large number of samples. Finally, because sample preparation is simple and straightforward, the method should replace existing, more complicated methodologies.
References
- McEvoy, J.D.G. Anal. Chim. Acta2002, 473, 3–26.
- Ministry of Health, Italian National Plan for Feed Control, 2000.
- Commission Directive 98/19/EC of 18 March 1998. Amending Council Directive 70/524/EEC concerning additives in feedingstuffs.
- Council Regulation (EEC) No. 2377/1990 of 26 June 1990. Laying down a community procedure for the establishment of maximum residue limits of veterinary medicinal products in foodstuffs of animal origin.
- Council Regulation (EC) No. 1756/2002 of 23 September 2002. Amending Council Directive 70/524/EEC concerning additives in feedingstuffs as regards withdrawal of the authorisation of an additive and amending Commission Regulation (EC) No. 2430/1999.
- Williams, B.J.; Shively, J.E. Vet. Med./Small Anim. Clin.1978, 73, 349.
- Commission Regulation (EC) No. 2788/98 of 22 December 1998. Amending Council Directive 70/524/EEC concerning additives in feedingstuffs as regards the withdrawal of authorisation for certain growth promoters.
- Regulation (EC) No. 1831/2003 of the European Parliament and of the Council of 22 September 2003. On additives for use in animal nutrition.
- Commission Regulation (EC) No. 2205/2001 of 14 November 2001. Amending Council Directive 70/524/EEC concerning additives in feedingstuffs as regards withdrawal of the authorisation of certain additives.
- Chieri, U.R. J. AOAC, 1978, 61, 92.
- Buzard, J.A.; Ells, V.R.; Paul, M.F. J. AOAC1956, 39, 512.
- Smallidge, R.L. J. Assoc. Anal. Chem. 1985, 68, 1033.
- McCracken, R.J.; Kennedy, D.G. J. Chromatogr. A1997, 771, 349–54.
- Van Poucke, C.; De Keyser, K.; Baltusnikiene, A.; McEvoy, J.D.G.; Van Peteghem, C. Anal. Chim. Acta2003, 483, 99–109.
- Mortier, L.; Daeseleire, E.; Van Peteghem, C. J. Chromatogr. B2005, 820, 261–70.
- Ministry of Health, Italian National Plan for Feed Control, 2005.
- Perez, N.; Gutierrez, R.; Noa, M.; Diaz, G.; Luna, H.; Escobar, I.; Munive, Z. J. AOAC Int.2002, 85, 20.
The authors are with the Istituto Zooprofilattico Sperimentale dell’Umbria e delle Marche, Via Salvemini 1, 06126 Perugia, Italy; tel.: +39075343253; fax: +3907535047; e-mail: [email protected]. The authors are grateful to Mr. John Dennis for the English text revision.