Comprehensive two-dimensional gas chromatography (GCxGC) has been enjoying increasing attention in recent years. Commercial availability of more user-friendly instruments and software significantly increased the number of adopters of the technique. Judging from the content of recently published GCxGC papers, the focus is gradually shifting from development of the technique itself to development of new applications. However, this raises some issues that many new users may not be aware of. This paper presents a brief overview of the complex interplay of experimental parameters that occurs in GCxGC and their effect on the final chromatographic separation.
GCxGC relies on the use of two GC columns with different selectivities that are coupled serially by a special interface (modulator).1,2 The modulator collects or samples the effluent from the primary column at a rate that allows the preservation of the separation accomplished in this column (typically 3–6 sec). These samples are then periodically injected into the second column, where additional chromatographic separation takes place. The procedure generates a series of short second-dimension linear chromatograms, which are then transformed by data processing software into two-dimensional chromatograms.3 The main advantage of GCxGC is the vastly increased peak capacity, being theoretically equal to the product of the peak capacities in the two separation dimensions. This feature was first exploited by researchers in the petroleum industry; later, GCxGC expanded into many other fields, including environmental analysis, foods and flavors, health research, and forensics.
The increased separation power of GCxGC comes at a cost of increased complexity of choosing and optimizing the separation conditions. In conventional GC separations (1-D GC), the number of parameters that need to be optimized is relatively small and includes the type of column (length, diameter, stationary phase type, and film thickness), carrier gas flow rate, and oven temperature program. At first glance, the task of optimizing a GCxGC separation appears to be easy. Typically, one chooses a nonpolar column for the first dimension (1D) (GCxGC nomenclature introduced by Schoenmakers et al.4 will be used here) that is moderately efficient, such as a 30 m x 0.25 mm i.d. (1dc) column with a 0.25–1.0 μm thick film (1df); this necessitates having a polar column in the secondary dimension (2D). Because the modulation period (PM) is typically short, and the goal is to have the second-dimension (2D) separation completed within approximately one modulation period, the secondary column is usually short as well (typically 0.5–2.0 m) to allow a fast separation. In order to maintain high efficiency in this dimension, a diameter of 0.1 mm (2dc) and a film thickness of 0.1 μm (2df) are commonly chosen. Then, all that remains for the chromatographer is to select an oven temperature program, carrier gas flow rate, and modulation period that enable all peaks to be adequately sampled by the modulator, and for all of the compounds to elute from the secondary column in the allotted time. This conventional approach to optimization, which treats the two separation dimensions somewhat independently, has governed the choice of separation conditions in the GCxGC community essentially since its beginnings.
When investigating chromatograms reported in the literature, the authors noticed that frequently the outcome of the separation seemed far from optimal. For example, common knowledge suggests that narrow-bore columns should provide the best efficiency in the second dimension; however, when comparing the chromatograms obtained using 2dc of 0.1 mm with similar separations conducted using column sets with a 2dc of 0.25 mm, often the second-dimension peak widths for major components were significantly larger for 2dc of 0.10 mm, with the remaining conditions being similar. This was due to overloading of the narrow-bore column in the second dimension, a phenomenon first described by Ong et al.5 The zone compression that occurs when using thermal modulators causes the local concentration of major analytes in the 2D column to be high enough to exceed the sample capacity of this column, which reduces the resolution and peak capacity in this dimension. With observations like this in mind, the authors devised a series of experiments to test the effects of 2D column parameters on the outcome of GCxGC separation.
Column diameter effect in the second dimension6
The influence of 2dc on 2D peak width was investigated with a series of 2D columns having lengths of 1 m and diameters ranging from 0.1 to 0.32 mm. The columns had different thicknesses of stationary phase to maintain a similar phase ratio, and were coupled to a 30 m x 0.25 mm x 0.25 μm nonpolar 1D column through a liquid nitrogen-based single-cryojet modulator.7 The samples used for the testing included a linear n-alkane test mix consisting of n-pentane through n-tridecane, and unleaded gasoline. Equal volumes of the pure alkanes were used to provide a concentrated stock mixture, which was then diluted 10–100,000 times in CS2 . All separations were conducted with the same volumetric flow rate of the carrier gas and oven temperature program.
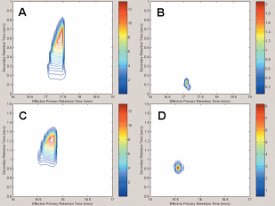
Figure 1 - Undecane peaks from the mixture of pure compounds (A, C) and the 1000× dilution (B, D) run on the 100-μm secondary column (A, B) and the 250-μm secondary column (C, D). Note how the mixture of pure compounds overloads both column sets in both dimensions, but the consequences are much more severe for the 100-μm secondary column. When the columns are not overloaded, the 100-μm capillary gives slightly better performance than the 250-μm capillary. (Figures 1 and 2 reprinted with permission from Ref. 6.)
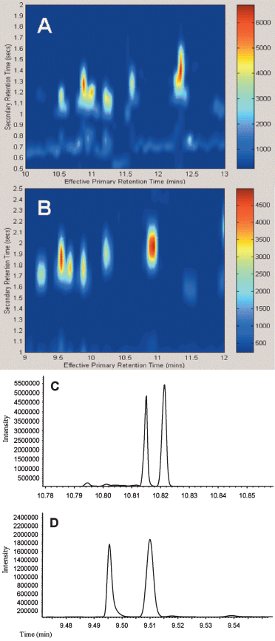
Figure 2 - A portion of the GC×GC chromatogram of gasoline using a 100-μm-i.d. second-dimension column (A), and a 250-μm column (B). The 1-D traces from these regions are shown for the 100-μm-i.d. second-dimension column (C), and the 250-μm column (D). The resolution obtained for this pair of compounds was 1.50 for the 100-μm column, but 2.47 for the 250-μm column.
When the mixture of pure compounds was analyzed, both columns were overloaded, regardless of their i.d. However, the overloading was much less severe for the 0.32- and 0.25-mm 2D columns than for the 0.15- and 0.10-mm columns, for which the second-dimension peak widths at the base (2wb) approached 1 sec. As the concentration of the analytes in the mixture decreased, the peak shapes improved as they became less overloaded in both dimensions. At a dilution of 10,000 times, the peaks were no longer overloaded in either dimension and had narrow Gaussian shapes. At this concentration level, the peaks eluting from the 0.10-mm column were the narrowest by a small margin, but the peaks obtained for the 0.25-mm column were still only ~120 msec at the base, which is more than adequate for GCxGC work. These effects are illustrated in Figure 1, which shows a comparison of the peaks produced by the 0.10- and 0.25-mm 2D columns in the GCxGC retention plane. It is clear that when 2dc was decreased, the overloaded peaks occupied a significantly larger space on the GCxGC retention plane. On the other hand, when the peaks were not overloaded at lower analyte concentrations, the area on the plane occupied by the peaks was comparable, almost irrespective of 2dc. This indicates that using narrow-bore columns in the second dimension might not be as advantageous as is commonly thought: At high analyte concentrations, these columns become overloaded earlier than wider-bore columns, and the overloaded peaks are broader; at low analyte concentrations, the peaks are somewhat narrower, but the difference is not very significant.
The effect of changing 2dc on the 2D resolution can be seen when investigating similar regions on the chromatograms of gasoline (C3 alkylbenzenes, Figure 2) obtained with 0.25- and 0.10-mm 2dc columns. The peaks were approximately of the same width in both cases, but the separation of the major peaks from the band of peaks below them (barely visible in the 0.25-mm plot) was better with the larger 2dc. When the raw data from the two regions were compared, the resolution obtained for the same sample pair of peaks was found to be 2.47 with the 0.25-mm column, but only 1.50 with the 0.10-mm column. Since none of the peaks was overloaded and the elution temperatures (Te) of the analytes were similar, this decrease in resolution was attributed primarily to the significantly increased linear velocity of the carrier gas in the second dimension when the 0.10-mm column was used. On the other hand, the increased linear velocity leads to shorter dead times in the second dimension, which is advantageous.