Genomics and proteomics have determined the
molecular sequences and structures of a large number
of proteins. The ultimate goal of understanding the
function, or dysfunction, of a specific protein
requires detailed knowledge of its localization within
the cells as well as its interactions with other proteins
and the pathways in which it participates.
Localizing protein activity within cellular structures
can provide important insights into all of these. Confocal microscopy is widely used in cell biology
and provides useful information about protein
dynamics, but its resolution is insufficient for precise
localization studies. Transmission electron microscopy (TEM) offers orders of magnitude
improvement in resolution and, when combined
with advanced labeling techniques using ultrasmall
gold particles, can localize proteins at the deep subcellular
level on a near nanometer scale. Recent
advances in electron microscope technology, particularly
in operation and application software, have
made the instruments significantly easier to use and
more accessible to the wide range of laboratories
involved in proteomics and cell biology research.
Bridging the gap
Electron microscopy (EM) has the ability to bridge
the resolution gap between the atomic-scale resolution
techniques required for primary structure analysis
and the micron-scale resolution typical of light microscopy. This will prove invaluable as proteomics
research moves to the analysis of structure–function
relationships, interaction pathways, and the role of
protein function in the intracellular organization.
Biologists have always confronted the same challenges
in their efforts to elucidate structure, the twin
needs for sufficient contrast and resolution. The flood
of molecular-scale information that has resulted from
recent progress in genomics and proteomics has put
renewed emphasis on the high-resolution imaging
available only by electron microscopy.
Biological materials are notorious for their low contrast
in both light and electron microscopy. Historically, scientists
have tackled this problem with increasingly
sophisticated staining and labeling techniques.
Microscopists have developed a broad range of techniques
that preferentially stain different cellular components.
For example, hematoxylin, which is attracted to
negatively charged molecules, is used to locate DNA,
RNA, and acidic proteins with a light microscope. In a
TEM, contrast depends on the mass thickness, and stains
are typically salts of heavy metals such as uranium and
lead. Staining remains an important way to reveal higher
level structure, but it lacks the specificity required to distinguish
particular proteins or other macromolecules.
Immunological labeling techniques can identify specific
molecules or even fractions of molecules and localize them
with nanoscale precision relative to surrounding cellular
structures. In light microscopy, labeling focuses on attaching
fluorescent markers that offer very high sensitivity, but
remain spatially limited by the resolving power of the microscope. In TEM, the markers are usually gold particles
that offer high contrast against a biological background
composed primarily of lighter elements. Conventional
gold particles have diameters of several nanometers, which
limits their ability to penetrate deeply or reach within
some cellular structures. As described below, ultrasmall
gold particles address many of the shortcomings of traditional,
larger gold labels. Another class of TEM labeling
techniques involves the use of an enzyme label that reveals
the location of its target by catalyzing a local reaction that
creates high-contrast reaction products. Enzyme labels
offer high sensitivity since a single label molecule can create
many marker molecules, but their spatial resolution is
limited by diffusion of the markers.
Ultrasmall gold particles
Ultrasmall gold particles (USG), less than 1 nm in
diameter, offer better sensitivity and penetration than
larger gold particles, and higher spatial resolution than
enzyme labels. Silver enhancement techniques, which
add silver to the USG particle after it has found its target,
increase the label’s visibility. Sequential silver
enhancement permits the simultaneous labeling of
more than one target species for co-localization studies.
Prior to the introduction of USG, most ultrastructural
localization studies were confined to identifying the
nature of the labeled element. In contrast, USG can
precisely locate the labeled element within its structural
context. For example, in neuroscience, USG can
pinpoint the location of a receptor protein to its functional
site on the neuronal membrane. Other examples,
discussed below, demonstrate the resolution, penetration,
and antigen accessibility of the USG technique.
Localization resolution
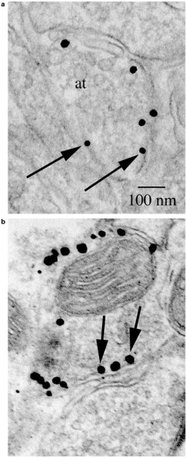
Figure 2 - Dopamine transporter labeled (N-terminus as in
Figure 1) with silver-enhanced USG particles. The labels
(black dots, some indicated by arrows) are clearly localized on
the cytoplasmic side of the axon terminal (at) membrane.
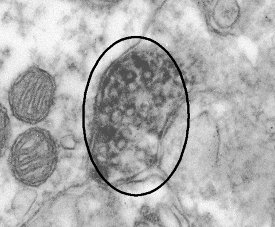
Figure 1 - Dopamine transporter labeled with an enzyme-based
(peroxidase) method. The primary antibody is specific to the N-terminus
of the DAT molecule. The reaction products (dark regions)
fill the axon terminal, making it impossible to localize the protein on
any finer scale.
The dopamine transporter (DAT) is a protein in the
central nervous system responsible for removing
dopamine from the extracellular space after synaptic
transmission. In striatum, it is found in the terminals
of dopaminergic axons. Enzyme-based labels have
insufficient spatial resolution to localize the protein
within the terminal. In Figures 1 and 2, DAT was
labeled with a primary monoclonal antibody specific
to its N-terminus. The primary antibody was subsequently
detected with an enzymatic peroxidase label.
The peroxidase reaction products appear to fill the
entire terminal (Figure 1). However, when the primary
antibody was labeled with USG (Figure 2), the
silver-enhanced particles were clearly associated with
the cytoplasmic side of the terminal membranes. Only
the combination of EM and USG offers sufficient resolution
to localize proteins with respect to structures
such as intracellular membranes and organelles.
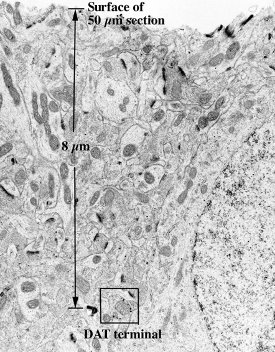
Figure
3 - USG reagent penetration. Labeled DAT is
apparent to a depth of 8 μm.
Reagent penetration
Conventional gold particles, with diameters of several
nanometers, have demonstrated a limited ability to penetrate
the sample. The lack of penetration is difficult to
account for based on particle size alone. One explanation
proposes that the effective radius of the particle is
increased by several nanometers by a surrounding cluster
of water molecules. USG are perhaps small enough to
prevent the formation of the water jacket, giving them
an ability to penetrate that is disproportionate to the
decrease in particle size alone. The sample in Figure 3 is
from a 50-μm-thick section that was labeled for DAT
with USG prior to embedding. The thick section was
then cut into thin sections perpendicular to the original
section, such that the edge of the thin section originated
in the surface of the thick section. Labeled DAT can be
seen to a depth of 8 μm. In another study that labeled
parvalbumin with the same method, labels could be seen
up to 12 μm below the section surface.