In the world of laboratories, the discerning eye of an
efficiency expert must wince while witnessing sample preparation. Nowhere else in the laboratory is
there such an erratic work flow.
Laboratorians measure, heat, mix, centrifuge, and extract fragile biological samples in preparation for
accurate analyses. Incessant deadlines attempt to
maximize output, but the batching protocol for
plasma and serum samples fractures any illusion of
automation.
Over 330,000 specimens are processed per year by a
typical hospital or independent laboratory,1 with 85%
requiring some form of preanalytical preparation.2
Current methods require a medical technician to
make more than 60 decisions while preparing a sample.
The extrapolated conclusion here is that sample
preparation—in a high-work-flow laboratory—is a
by-product of 16.8 million decision points yearly, at
zero tolerance for error.
Laboratories today are investing in large, complex
laboratory automation systems that emulate manual
techniques. Much of this technology does not appear
to improve or streamline the sample preparation
process. If we are serious about laboratory automation,
we must dissect the process of sample preparation,
locate the inherent flaws, fixate on delays, and
reinvent the technology until the word “efficiency”
can be honestly reapplied to the entire laboratory.3
Centrifugation as a sample preparation technology
There is no better place to begin our critical examination
of sample preparation than to look at centrifugation.
Centrifugation is, by far, the most common form of plasma and serum separation
(70–80% of blood specimens are centrifuged).4 The technology’s primary drawbacks
are the subjugation of living organic
matter to 10–15 min of immense pressure—amounting to 1000–5000 g forces—and the
delays.
Why, then, should we be surprised that after
a resultant sample is analyzed, measured,
and interpreted, the analysis must be
rejected? After all, we have created the
harshest of conditions for cells, large proteins,
and molecules. Therefore, it should
not shock us that some results of subsequent
analyses mandate reprocessing.
Present-day methods require large ancillary
equipment investments for already shrinking
floor space, and entail additional
planning to calculate loading times,
spin-up times, spin-down times, and
unloading times. In addition, centrifuging
exacerbates batching, further delaying the
entire process.5
Microfiltration: a reliable, alternative technology
Is there a logical alternative to centrifugation?
Microfiltration gently separates living cells,
thereby ensuring the integrity of the specimen and, more
importantly, completely eliminating centrifugation.
Through specially constructed disposable filter cells
approximating the length of a baby’s finger, microfiltration
has evolved beyond an original
concept of cross-flow and/or tangential-flow
filtration.6,7
Basic microfiltration system
The fundamental microfiltration system from
Bio/Data Corporation (Horsham, PA) comprises
three primary components: 1) disposable
filter cell, 2) filtration module whose
design is determined by the back-end application,
and 3) proprietary software that manages
and controls the microfiltration process.
The filtration module processes the filter cell
(Figure 1). The filter cell’s patented architecture
highlights the intricate realities of
microfluidics therein. A whole-blood specimen
is precisely manipulated between two
reservoirs over a microporous membrane and
then along a specially designed, smoothly
sculpted flow channel.
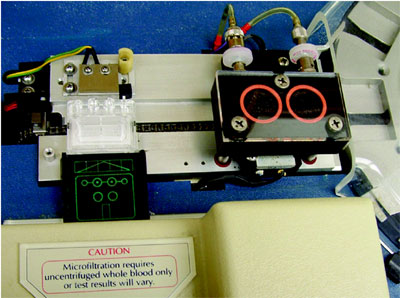
Figure 1 - A filter cell (left) awaits injection of a specimen before cellular
and fibrin solids are removed from the processed plasma (or serum) in
the filtration station (right) during microfiltration. This image was photographed
inside the Microsample Coagulation Analyzer™ model MCA-210 (Bio/Data).
A back-and-forth motion continually cleans the
membrane pores. Optical sensors control the sample
movement until virtually cell-free plasma is determined
to be present. All the preanalytical variables
are radically reduced, as 400 μL of plasma for analytical
testing is produced from 2 mL of whole blood in
45 sec. The software ensures precision in the amount
of the deliverable sample.
Technicians’ involvement is minimized, as is their
exposure to blood-borne pathogens. The laboratory
manager now observes a single operation in which the
plasma or serum is extracted. In addition, the primary
sample tube is never uncapped. (Microfiltration also
eliminates the sample pumps and rinse fluids required
in most analyzers.)
The filter cell
A plastic, disposable microfiltration filter cell comprises
three or four elements:
- Reservoir, to contain the sample—The reservoir consists of two
equal-volume chambers that, when assembled with the base, are connected
via a horizontal flow channel.
- Microporous membrane, 0.6 μm pore size, positioned between the reservoir and base with a flow channel above and a collection grid below.
- Base, which collects and delivers the filtrate for processing or testing.
- Cover sheet attached below the collection area to the bottom of the base (optional, dependent upon design).
Filter cells are intended to reside in an analyzer,
whose design varies by analysis type, e.g., optical
(density, color, or fluorescence), electrical (conductance
or impedance), or mechanical (magnetic bead
or bar). Design also depends upon whether test
reagents are introduced into the filter cell.
System operation
Two optical paths in each of the filter cell’s two reservoir
sections are continuously monitored by detection
circuitry arrays in the filtration module. The
two paths correspond to the lower and upper levels
of each reservoir, and the results from the optical
arrays engage and disengage the system’s variable filtration
motion, and determine when the proper volume
of plasma or serum is achieved (Figure 2a).
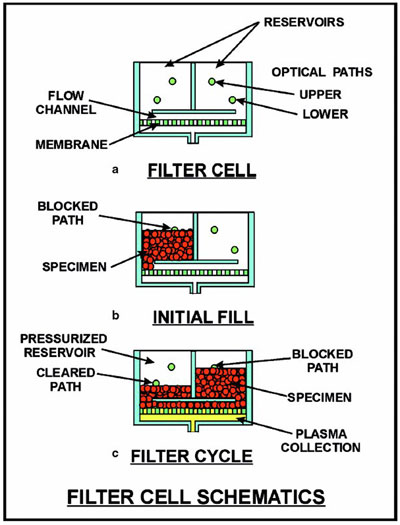
Figure 2 - Schematics depict how the optics from a filtration module guide
the back-and-forth movement of a specimen across a microporous membrane:
a) basic filter cell, b) introduction of a specimen into the cell, and c) operation
during microfiltration.
When both optical paths are clear, no blood is present.
If the paths in one reservoir are blocked, a fluid
is in the chamber. A filter cell is moved into position
to initiate operation, and the optical system checks
to confirm two paths in one reservoir chamber are
blocked and two paths in the other chamber are
clear (Figure 2b).
A pneumatic system gently pressurizes the side of the
reservoir whose upper path is shown to be blocked. The
pressure eases the blood down a passageway in the bottom
of the filled reservoir chamber into the flow channel,
across the microporous membrane, and up through
a passageway in the bottom of the empty chamber.
The pressure differential causes plasma to pass
through the membrane, as cells flow across the membrane
surface. The pressure continues to be applied until the lower optical path indicates the chamber is
clear, at which time the pressure is relieved.
The system then checks the opposite chamber to
ensure its lower path is blocked. Once confirmed,
pneumatic pressure is applied to that reservoir until
optics confirm its lower path has cleared. Thus, an
alternating forward-reverse flow ensues. Once the
optical sensors indicate a predetermined sample volume
has been produced, the plasma or serum is
promptly removed for analysis (Figure 2c).8
Plasma quality
The indiscernible attributes of native plasma are
maintained in microfiltration, because the separation
method is less traumatic to the cellular matter
in blood. The filtration pressure—about 129 mm of
mercury—is comparable to normal blood pressures of
120–140 mm of mercury. Cells are not subject to
extreme forces or pressures and do not excrete activating
materials into the plasma.
The effectiveness of plasma extraction may be gauged
upon how many residual platelets—the smallest cells
in blood—reside in the sample. For an example of
microfiltration’s effectiveness, blood was drawn from
three people and each specimen was placed into a
sodium citrate anticoagulant. The specimens were then
apportioned into batches of 20 and 16 for processing by
microfiltration and centrifugation, respectively.
The 20 specimen tubes were processed sequentially
for 30 sec each, utilizing the MCA-310 microfiltration coagulation analyzer (Bio/Data) with the filter
cells. The other 16 specimens were collectively spun
using a centrifuge at 2500 × g for 15 min.9
Platelet counts in the centrifuged samples ranged
from 4490 to 8000, well within the Clinical Laboratory Standards Institute’s tolerance of 10,000 platelets per cubic millimeter in “platelet-poor
plasma.”9 By comparison, microfiltration-prepared
samples were so low in platelets that final results had
to be determined manually. The samples studied contained
fewer than 200 platelets per cubic millimeter,
0.5% of centrifugation’s allowance (Table 1);10 thus,
samples processed by this technology can be
described as “virtually platelet-free plasma.”
Summary
Clinical managers are constantly evaluating, reviewing,
and reevaluating how their protocols expedite or
slow down the work flow. The constant emphasis on
better methods of sample preparation is a self-admission
of the challenges faced by laboratories utilizing
centrifugation. Microfiltration rapidly separates
plasma or serum from whole blood and easily integrates
into automated configurations to complement
standard laboratory testing.
The advantages of microfiltration are:
- Simplification of the sample preparation process, enhancing automation.
- Elimination of centrifugation.
- Major reduction of time required to obtain plasma or serum.
- Elimination of interferences from cellular materials.
- Suitability of samples for all existing test methods.
References
- Wolman, D.M.; Kalfoglou, A.L.; LeRoy, L. Medicare Laboratory Payment Policy: Now and in the Future. National Academy Press: Washington, DC, 2000; Table 2.1.
- Zakowski, J.; Powell, D. The future of automation in clinical laboratories. IVD Technol. Jul 1999, 5(4), 48–57.
- Valenstein, P.; Souers, R.; Wilkinson, D.S. Staffing benchmarks for clinical laboratories. Arch. Pathol. Lab. Med. Apr 2005, 467–73.
- Holman, J.W.; Mifflin, T.E.; Felder, R.A.; Demers,
L.M. Evaluation of an automated preanalytical robotic workstation at two academic health centers. Clin. Chem.2002, 48(3), 540–8. - Pfister, M. Laboratory automation—industry transformation or dead end. HBS Quarterly (London), Mar 2004, 7–9.
- Van Reis, R.; Zydney, A. Membrane separations in biotechnology. Curr. Opin. Biotechnol.2001, 12, 208–11.
- Murkes, J.; Carlsson, C.G. Crossflow Filtration Theory and Practice. John Wiley & Sons, New York, NY, 1988.
- Coville, W.E.; Trolio, W.M. Preanalytical specimen preparation. J. Assoc. Lab. Automat. Mar 2000, 5(1), 72–80.
- Procedures for the Handling and Processing of Blood Specimens; Approved Guideline, 2nd ed. Clinical Laboratory Standards Institute (CLSI, formerly National Committee for Clinical Laboratory Standards), H18-A2, Oct 1999, 19(21).
- Laurich, M. Microfiltration Platelet Counts. Product Development Study Report, Bio/Data, Mar 1998.
Mr. Coville is Manager of Product Development, and Mr.
Loika is Corporate Communications Manager, Bio/Data
Corporation, 155 Gibraltar Rd., Horsham, PA 19044-0347,
U.S.A.; tel.: 215-441-4000; fax: 215-443-8820; e-mail: [email protected].