The traditional method of determining the cell cycle
phase of individual cells is by quantifying their total
DNA content using flow cytometry. For screening
purposes, however, flow cytometry has several shortcomings,
most notably, low throughput, the requirement
for a large number of cells, and the inability to
analyze adherent cell lines in situ.
With read times enabling over 2000 wells to be analyzed
per hour, the rapid whole-well scanning of an
Acumen eX3 microplate cytometer (TTP Labtech
Ltd., Melbourn Hertfordshire, U.K.) provides true
high-throughput cell cycle analysis capability. This is
demonstrated through the use of both permeabilized
and live cell populations labeled with a range of
DNA stains.
Experimental protocol
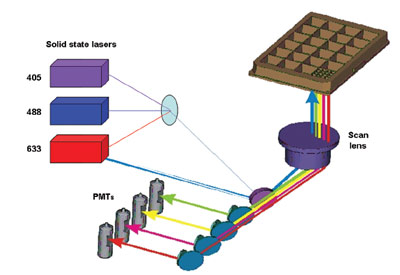
Figure 1 - Optical configuration of Acumen eX3 microplate cytometer.
For this study, a triple-laser Acumen eX3 (Figure 1)
was used for the determination of cell cycle analysis.
DNA dyes
Cell cycle analysis is typically performed on fixed,
permeabilized cells using a cell-impermeant nucleic
acid stain. However, to analyze live cells, a cell-permeant
nucleic acid stain is required. For fixed-cell
protocols, the most commonly used DNA dye is propidium
iodide (PI).1 While the choices for fixed-cell
staining are varied, there are only a few examples of
useful cell-permeant nucleic acid stains. The application
of microplate cytometry for high-throughput cell cycle analysis using propidium iodide has been
demonstrated previously.2 The performance of a
range of DNA dyes using all three lasers in an Acumen
eX3 was compared.
In this study, five different fluorescent DNA dyes
were used, which were suitable for use with one of
the Acumen eX3’s lasers. Dyes included Hoechst
34580 (405 nm), Vybrant® DyeCycle™Orange
(488 nm) (Molecular Probes [Invitrogen],
Eugene, OR), PI (488 nm), TO-PRO-3 (633 nm)
(Molecular
Probes), and DRAQ5™ (633 nm)
(Biostatus
Ltd., Leicestershire, U.K.).
Cell cycle arrest
protocol
For all assays, HeLa cells were seeded
into a 384-well microplate at a density of
2000 cells per well. Cells were incubated
at 37 °C/5% CO2 for 18 hr prior to treatment
with vehicle or vinblastine for 22
hr at 37 °C/5% CO2.
Fixed-cell staining
For fixed-cell studies, the following fixation
protocol was used. The medium was
carefully aspirated from each well, and 50
μL of –20 °C 80% ethanol in phosphate-buffered
saline (PBS) was added to each
well. Cells were incubated at –20 oC for 30
min. Each well was washed twice with 100
μL PBS. After the second wash, the PBS was aspirated off, and 50 μL of a 0.2-mg/mL RNAse
solution (DNase free) in PBS was added to each well.
The plate was incubated for 1 hr at 37 °C. The RNAse
solution was aspirated off the wells, and either 50 μL
of a 10-μM PI solution in PBS solution, 50 μL of a 10
μM Hoechst 34580 solution, or 50 μL of a 0.5-μM TO-PRO-3 solution was added to relevant wells. The plate
was sealed with a black cover-seal and incubated in the
dark for 15 min at room temperature. The plate was
loaded into an Acumen eX3 microplate cytometer.
Live cell staining
The live cell stains offered a more simplified protocol as
the dyes were added directly to the treated cells. Following
incubation with vinblastine for 22 hr as described
above, 5 μL of 50 μM DRAQ5 or 5 μL of 50 μM
Vybrant DyeCycle Orange was added directly to each
well. The plate was sealed with a black cover-seal and
incubated in the dark for 30 min at room temperature.
Analysis was performed on an Acumen eX3 microplate
cytometer using 488-nm or 633-nm excitation.
Plate scanning
The plates were scanned at a sampling resolution of
1 μm in the X direction and 8 μm in the Y direction.
The photomultiplier tube (PMT) voltage for each
channel was determined for each dye used. Cells
were defined as having a width and depth of between
10 and 100 μm. The phases of cell cycle were classified
using the Total Intensity object characteristic.
Results and discussion
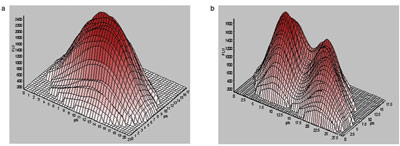
Figure 2 - Comparison of the fluorescent profiles of a G1 and G2/M nucleus.
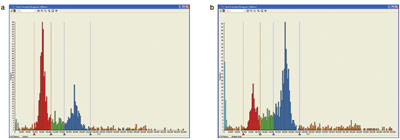
Figure 3 - Vinblastine arrest of cells into the G2/M phase of the cell cycle in HeLa cells. The red population indicates cells in G1
phase of the cell cycle; the blue population indicates cells in G2/M phase of the cell cycle.
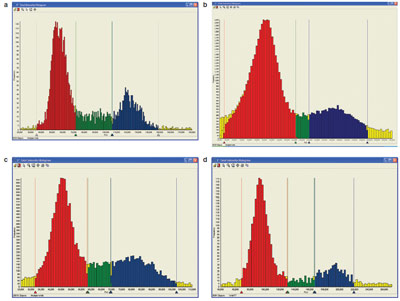
Figure 4 - Comparison of different DNA stains for cell cycle excited at 405, 488, and 633 nm. a) Propidium iodide, b) Hoechst
34580, c) Vybrant DyeCycle Orange, and d) TO-PRO-3. The red population shows cells in G1; the blue population shows cells in G2/M.
It is possible to generate three-dimensional models
of fluorescent objects, including nuclei. This permits
visual determination of the number of nuclei present
in each cell. The multiple sampling also means that
integration of fluorescence intensity is not affected
by the presence of multiple nuclei, leading to well-defined
peaks for cells in G1 and G2/M phases, as
shown in Figure 2. From a histogram showing total
dye intensity in the nucleus, the relative amounts
of DNA in each nucleus can be determined. Using
this parameter, all of the single cells in the well were
classified into the different phases of the cell cycle.
Figure 3 shows a defined shift of the cells from G1
into G2/M phase upon cell cycle arrest by 10 μM
vinblastine treatment for 22 hr. By calculating the
total cell count across the whole area of the well,
mathematical models were then used to calculate the percentage of cells occupying the different phases of
the cell cycle from G1, S, and G2/M.
By using this method of calculating dye intensity and relating
it to DNA content, the use of different fluorescent dyes
on cell cycle analysis was examined. In addition to PI, cells
were also stained with Hoechst 34580, Vybrant DyeCycle
Orange, and TO-PRO-3. The analysis shows good correlation
between all four dyes, giving typical DNA histograms
under control conditions as shown in Figure 4.
Live cell stains
Live cell dyes are less frequently used in cell cycle analysis.
The main advantages of using live cell dyes is that
the assay protocol is relatively much simpler, predominantly
since it does not require a fixation step or, in
the case of PI, an RNAse treatment step. DRAQ5 was
used as a 633-nm excitable DNA stain. DRAQ5 has a
far-red emission and has previously been used in DNA-specific,
stoichiometric cell cycle analyses. Because it is a far-red dye, it has no overlap with green fluorescent
protein/fluorescein isothiocyanate (GFP/FITC) and
there is no need for it to be washed out, making it well
suited for a homogeneous one-step assay.
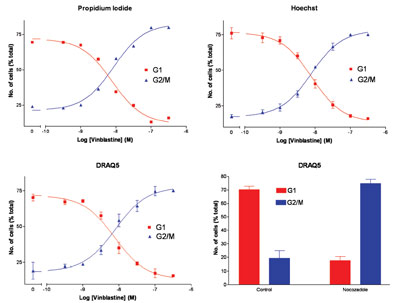
Figure 5 - Comparison of the 633-nm excitable dye, DRAQ5, to other DNA stains.
The concentration dependence of vinblastine against
the percentage of cells in G1 and G2/M phase of the
cell cycle was determined. As can be seen in Figure 5,
it was found that DRAQ5 gave comparable responses
to those obtained with the more established dyes, PI
and Hoechst 34580. In addition to the concentration
response curves, the effect of using nocozadole
to induce G2/M arrest was also investigated, and the
results demonstrate that the effects were similar to
those obtained using vinblastine.
Summary
The utility of microplate cytometry for cell cycle
compound profiling has been demonstrated using as
standard agents vinblastine and nocozadole, which
arrested HeLa cells in the expected phase of the cell
cycle. The ability to use any of the Acumen eX3’s
lasers for cell cycling illustrates that there is a large
degree of flexibility to use the remaining lasers for
multiplexing cell cycle studies with a secondary assay
such as mitotic index.
The results demonstrate that there was no real difference
in using either the cell-impermeant nucleic
acid stains, PI and TO-PRO-3, or the permanent
nucleic acidic stains, Hoechst 34580 and DRAQ5.
For assays determining cell cycle analysis only, where
the protocol is much easier than fixation steps, there
is no negative impact when using live cell stains.
For screening purposes, the throughput of a
microplate cytometer for cell cycle analysis is unparalleled,
since it is able to analyze in a few hours what
normally takes a week on a flow cytometer.3 Because
all the cell processing is performed with microplates,
it is also more amenable to automation. The novel
design features of the Acumen eX3 microplate cytometer
used in these studies permit multiplex, whole-well
analysis at high read times compatible with primary
screening campaigns, with daily throughputs of
30,000 compounds per day being reported for some
assays. For cell cycle analysis, automated throughput
of 384 samples in 10 min has been achieved.
In summary, microplate cytometry offers a high-content,
high-throughput approach to cell cycle
analysis that can eliminate current bottlenecks in
drug discovery screening campaigns.
References
- Crissman, H.A.; Steinkamp, J.A. Rapid, simultaneous
measurement of DNA, protein, and cell volume in
single cells from large mammalian cell populations. J.
Cell Biol. 1973, 59, 766–71.
- Bowen, W.P.; Wylie, P.G. Application of laser-scanning
fluorescence microplate cytometry in high content
screening. Assay and Drug Development Technol.2006, 4(2), 209–21.
- Kittler, R.; Pelletier, L.; Heninger, A.-K.; Slabicki,
M.; Theis, M.; Miroslaw, L.; Poser, I.; Lawo, S.; Grabner,
H.; Kozak, K.; Wagner, J.; Surendranath, V.;
Richter, C.; Bowen, W.; Jackson, A.L.; Habermann,
B.; Hyman, A.A.; Buchholz, F. Genome-scale RNAi
profiling of cell division in human tissue culture cells.
Nature Cell Biol. 2007, 9(12), 1401–12.
Dr. Wylie is Product Manager, TTP Labtech Ltd., Melbourn
Science Park, Melbourn Hertfordshire SG8 6EE,
U.K.; tel.: +44 1763 262626; fax: +44 1763 261964;
e-mail: [email protected].