Laser diffraction has been the most common particle size analysis technique for many years. The technique is fast, flexible, and easy to use for a wide variety of sample types. Knowledge of the sample and dispersing medium refractive index (RI) is often required to generate the most accurate results when using laser diffraction. For this reason, some users have struggled with how to choose the optimum RI values for certain samples. A new automated calculation routine is described that facilitates the selection of optimum RI values.
Laser diffraction theory and system design
Particle size analyzers based on laser diffraction collect scattered light on detectors at various angles and convert this information into a particle size distribution. Most modern laser diffraction instruments use some implementation of two approaches for the conversion of scattered light energy into the calculated particle size distribution result: Fraunhofer and Mie theory. The Fraunhofer approximation is sometimes used for large (>50 μm), opaque particles. The more complete Mie theory is typically used as the default approach and is highly recommended for smaller particles (<20 μm) since this generates more accurate results.1,2 The price to pay for this increased accuracy is the requirement to enter the RI values for both the particles and the dispersing medium.
Refractive index has two components, the real and the imaginary, as shown in Eq. (1):
RI = n – ik
(1)
Where:
n = The real component (velocity of light in vacuum/velocity of light in the particle)
i =  – 1
– 1
k = The extinction coefficient of the particle.
The RI serves two purposes: 1) to correctly model how light interacts with the sample material, and 2) to compensate for nonideal characteristics of those particles. The first point involves what is referred to as the real component of the refractive index. The second point involves what is referred to as the imaginary component of the refractive index that models the absorption properties of the particles.
Several approaches can be used to determine the real RI component:
- Abbe refractometer
- Becke line tests
- Resources, including reference books and Internet searches.
There are few published values for the imaginary component, and many laser diffraction users struggle to select the value that produces the most accurate results. The imaginary component is a value between 0.0 and 10.0 with perfectly clear, spherical particles having a value of 0, and highly absorbing dark particles having a value of 1 or higher.
One method to determine the optimum RI value (real or imaginary) is to compare the actual collected scattered light to the theoretical scattered light that would be generated by the calculated particle size distribution result. The R parameter value is a calculation of the difference between the actual and theoretical light scattering on each detector, as shown in Eq. (2):
Where:
N = The number of detectors used for the calculation
yi = The measured scattered light at each channel (i) of the detector
y(xi) = The calculated scattered light at each channel (i) of the detector based on the chosen refractive index kernel and reported particle size distribution.
A minimized R parameter value indicates good agreement between the actual and theoretical light scattering, signifying a preferred result. Figure 1 shows the actual and theoretical light scattering. This value can be used to help select RI values that generate the most accurate results.
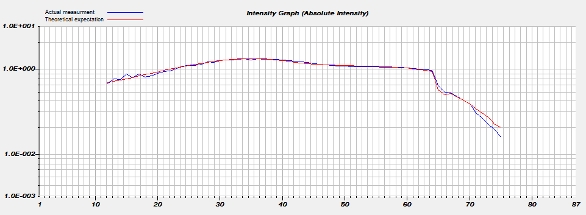 Figure 1 – Actual vs theoretical light scattering vs detector number (angle).
Another useful calculation built into some laser diffraction software packages is the Chi square value defined in Eq. (3) using the terms defined in Eq. (2), plus one additional variable,  i:
i:
Where:
i = The standard deviation of the scattered light intensity at each channel (i) of the detector.
The Chi square calculation also tracks RI value selection, but gives an additional indication of instability during the measurement. Higher Chi square values indicate that the sample was changing during the measurement (dissolution, agglomeration, bubble formation), which should always be avoided when using this technique.
The most recent software package used in the HORIBA LA-950 laser diffraction analyzer (HORIBA Scientific, Kyoto, Japan) includes an automated calculation wizard that facilitates RI selection. The user makes one measurement of the sample and then uses the calculation wizard in the Method Expert software package to vary RI and search for a minimum R parameter value. Most often, the real RI value is held constant, and the Method Expert package calculates up to five results using different imaginary component values. The user then selects the imaginary component that generates the result with the lowest R parameter value. Alternatively, the imaginary value can be fixed, and the Method Expert package searches for optimum real component values.
Materials
Two samples supplied by customers were used to test the RI calculation wizard. One sample was used to search for the optimum imaginary component and one sample to search for the optimum real component. The sample used for the imaginary component study was a micronized pharmaceutical active ingredient supplied by a customer. The real refractive index component was determined to be 1.58 using the Becke line technique. The median size was expected to be somewhere near 6 μm. The sample used for the real component study was a water-in-oil emulsion sample created in the oil production industry supplied by a customer. The median size was expected to be somewhere near 5 μm.
Results
Sample 1 was measured once and the result saved. The real RI component value for this sample was determined via the Becke line method and kept constant. This study investigated how calculated results varied using imaginary values of 0, 0.01, 0.1, 1.0, and 10. The Method Expert package created scattering models for each RI value, generated results for each, and generated multiple graphs and tables to aid in the selection of the optimum imaginary component. Figure 2 and Table 1 show how the calculated particle size distributions and R parameter varied as a function of imaginary component value.
 Figure 2 – Particle size distribution as a function of varying imaginary RI component.
Table 1 – Particle size and R parameter results as a function of varying imaginary RI component for sample 1
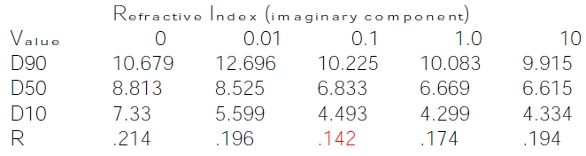
For this sample, the R parameter is minimized at an imaginary component value of 0.1, indicating the most accurate result. This is the imaginary component most frequently used for pharmaceutical white powders.
For sample 2, the imaginary RI component value was fixed at 0 since emulsions are both transparent and spherical. This study investigated how calculated results varied using real values of 1.25, 1.30, 1.33, 1.35, and 1.40. Figure 3 and Table 2 show how the calculated particle size distributions and R parameter varied as a function of the real component value.
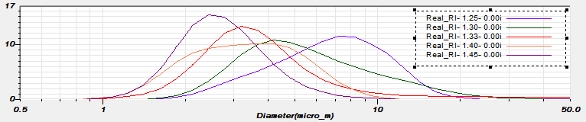 Figure 3 – Particle size distribution as a function of varying real RI component.
Table 2 – Particle size and R parameter results as a function of varying real RI component for sample 2
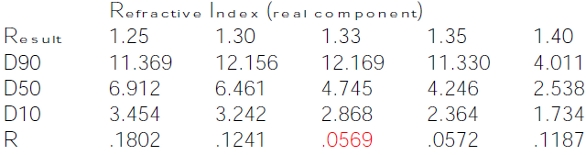
For sample 2, the R parameter calculation is at a minimum for the real RI component value of 1.33, indicating this generates the most accurate result. Since the dispersed phase was water (RI = 1.33), this confirms the ability of these calculations to determine the optimum RI choice.
Conclusion
The Method Expert calculation wizard described in this study proved to be a quick and easy way to choose the optimum RI values that generated the most accurate results. The wizard automated a process that many users performed manually in the past. The generated results that are available in both graphical and tabular form (not shown here) facilitate the RI selection process and provide excellent recordkeeping for method development and validation. A word of caution is required: This approach works most of the time, but one must consider if the results chosen by the calculation wizard match expected reality.
References
- ISO 13320, Particle size analysis—Laser diffraction method.
- Boer, G.B.J.; de Weerd, C. et al. Laser Diffraction Spectrometry: Fraunhofer Diffraction Versus Mie Theory. Part. Charact. 1987, 4, 14–19.
Mark Bumiller is European Manager, Particle Analysis Products, HORIBA Scientific, 16 Rue du Canal, 91165 Longjumeua, Cédex, France; tel.: +33 (0)1 69 74 72 00; fax: +33 (0)1 69 09 07 21; e-mail: [email protected].