Part 1 of this article (Am. Lab. Apr 2013, 45[4], 24–6; https://www.americanlaboratory.com/913-Technical-Articles/134643-Putting-the-More-in-Morphology-Part-1/) discussed the impact of multiplexing morphological methods, multiparametric techniques, and supervised machine-learning to answer the question “what” is there, as well as “where” and “how much.” Part 2 investigates the impact of adding multispectral imaging (MSI), not only as a tool for segmentation and classification, but as an effective mechanism for removing pervasive autofluorescence, dramatically improving signal-to-noise and enhancing contrast. Finally, this second installment pulls together the full arsenal, demonstrating the real-world impact of the integrated suite.
Going multispectral
Spectral unmixing and the impact of autofluorescence
 Figure 1
 – L
iver stained with Alexa Fluor® 488 (Life Technologies, Grand Island, NY) (green = PMP-70), Cy3 (red = SE-1), and Hoechst (blue = nucleus). a) Conventional RGB fluorescence image, before spectral unmixing; b–e) spectrally segmented images for Hoechst, Alexa Fluor 488, Cy3, and autofluorescence, respectively; f) composite of the three fluorophores, minus the autofluorescence, after spectral unmixing. (Images courtesy of Laszlo Komuves, Genentech, South San Francisco, CA.)As an imaging modality, fluorescence provides linearity and dynamic range, excellent potential for multiplexing, great sensitivity, and a strong basis for quantitation. However, in formalin-fixed paraffin-embedded (FFPE) tissues, fluorescence imaging suffers from several disadvantages. First, fluorophores often exhibit spectral overlap, making them difficult to separate accurately. Second, as clearly demonstrated by Figure 1e, in tissue sections, autofluorescence is surprisingly pervasive, masking signals, reducing contrast, and drastically affecting quantitation. Unfortunately, that problem cannot be solved by simply adjusting brightness or contrast or doing background subtraction.
In comparison, the unmixing of fluorescence spectra using devices such as Nuance, TRIO, or Vectra results in well-defined, specifically located fluorophores (Figures 1b–d) and more accurate structural information (Figure 1f), all separated cleanly from the tissue autofluorescence.1 The increased clarity resulting from eliminating autofluorescence also ensures validity of more delicate textural measurement. Studies of these images have suggested a 50 to 300× improvement in the signal-to-background ratio.2
Spectral mixing has an additional, unexpected advantage. As demonstrated in Figure 2, the spectrally unmixed images can be presented against a dark background (digital fluorescence) or a white background (digital brightfield).
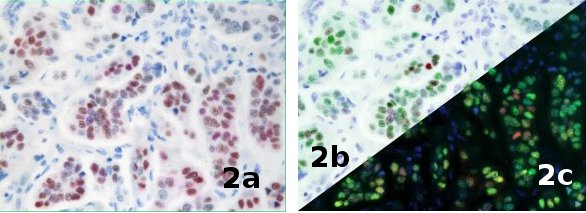
Figure 2 – Breast tumor stained with estrogen receptor (ER), progesterone receptor (PR), and hematoxylin. a) RGB image, b) digital brightfield image, c) digital fluorescence. (Images courtesy of James Mansfield, PerkinElmer.)
Pulling it all together
Figures 3 and 4 illustrate the full power of combining multiplexed immunohistochemistry (IHC) and multispectral imaging with tissue morphology and multiparametric analysis.3 To prepare the sample, breast tissue was stained with three different chromogens, each staining for a different antigen: Vector blue (progesterone receptors, PR), DAB (3,3’-diaminobenzidine) (estrogen receptors, ER), and Vector red (HER2, human epidermal growth factor receptor 2), then counterstained with hematoxylin (nuclei). Traditionally in breast cancer cases, these three important protein markers would be analyzed separately, using time-consuming serial sections.4 Here, they are multiplexed in one section.
 Figure 3 – Tissue microarray, breast tissue, ER/PR/HER2 staining. a–d) A single tissue core and three images resulting from spectral unmixing of three IHC chromogens.
 Figure 3 – e–h) Tissue classification and cellular segmentation for four representative cores. Numbers indicate row and column within the microarray.
Figure 3a is the RGB image of a single tissue core, taken from a tissue microarray (TMA) of hundreds of tissue cores, each taken from a different individual. Figures 3b–d show the result of spectral unmixing the same image. Figures 3e–h represent the results of segmentation and classification on four different cores from the same TMA, each representing a sample from a different individual. Using Vectra, an automated multispectral scanning system, the microarray is scanned, first in color (RGB) at 4× magnification to locate each core, then multispectrally at 20× to image each core in detail. Each core in Figures 3e–h is identified by its row and column location in the array. These four sections were chosen at random to demonstrate the variability typically seen in a TMA.
After training, InForm® (PerkinElmer) first classified the biology of interest in each image: tumor (epithelial cells, red) versus stroma (green), and then segmented cell types using the unmixed hematoxylin image. Finally, it extracted the optical densities (ODs) of each the three biomarkers (ER, PR, and HER2) for the cells within the epithelial/tumor tissue in each core. High ODs signal high biomarker expression.
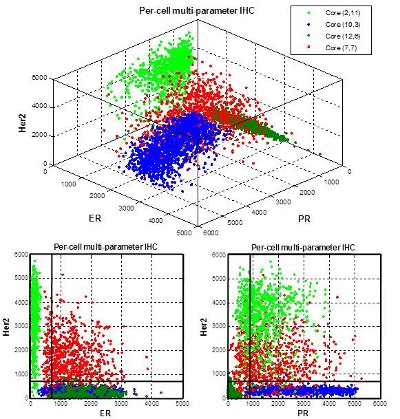
Figure 4 – Top: Per-cell multiparameter IHC correlation of progesterone (PR), estrogen (ER), and HER2 from the four tissue cores in Figure 2. Bottom left: estrogen:HER2 correlation. Bottom right: progesterone:HER2 correlation.
Using the core frame color to tag the values, the data from the four cores were then correlated in a three-dimensional scattergram (Figure 4). Slicing the data along just the ER or PR axes reveals strong ER:HER2 and PR:HER2 relationships from Core 7,7 and a strong PR:HER2 relationship in Core 2,11.
The future is now
From single cells living in culture to massive tissue microarrays and whole-slide images; from research biology to drug discovery to medical practice and pathology, how we collect and analyze images has changed.5 Leveraging the synergism of immunohistochemistry, morphometry, intensity, and texture with spectral unmixing and supervised machine-learning not only solves the most complex challenges of segmentation, but offers new methods of image classification and the next step in converting simple data into important answers.6 Suites of tools, united in design concept, running under common or related software, extending consistent, advanced measurement from molecule to cell to tissue to animal models to human samples, had been the dream of the lab of tomorrow. Clearly, that day has dawned.
References
- Mansfield, J.R.; Hoyt, C. et al. Visualization of microscopy-based spectral imaging data from multi-label tissue sections. Curr. Prot. Mol. Biol. 2008, 14.19, 1–14.
- Tam, J.M.; Upadhyay, R. et al. Improved in vivo whole-animal detection limits of green fluorescent protein-expressing tumor lines by spectral fluorescence imaging. Mol. Imaging 2007 Jul-Aug, 6(4), 269–76.
- Huang, W.; Hennrick, K. et al. A colorful future of quantitative pathology: validation of Vectra technology using chromogenic multiplexed immunohistochemistry and prostate tissue microarrays. Hum. Pathol. 2013 Jan, 44(1), 29–38.
- See, for example: http://pathology.jhu.edu/breast/biomarker-testing.php.
- Levenson, R.M.; Fornari, A. et al. Multispectral imaging and pathology: seeing and doing more. Expert Opin. Mol. Diagn. 2008, 2(9), 1067–81.
- Mansfield, J.; Levenson, R. Paving a new path: multispectral imaging in pathology. inFocus 2009, 14, 6–14.
Barbara Foster is President and Chief Strategic Consultant, The Microscopy & Imaging Place, Inc., 7101 Royal Glen, Ste. A, McKinney, TX 75070, U.S.A.; tel.: 972-924-5310; e-mail: [email protected]; www.MicroscopyMarket.com and www.MicroscopyEducation.com. The author wishes to thank James Mansfield and the PerkinElmer staff for their assistance in providing applications and explanations for this article. Author’s note: Different fields use different definitions of multispectral, hyperspectral, and spectral imaging, which makes their use confusing. Multispectral will be used throughout here.