Procedures for nucleic acid and protein quantitation have come a long way in the last three decades. In fact, the analysis of small samples (1–4 μL) is now routine in many life science laboratories. As labs face higher demands for small-volume analysis, faster and easier sample analysis is essential.
Until recently, lab instruments used for nucleic acid and protein quantitation required significant manipulation of the instrument and sample. For example, users typically need to raise and lower the arm manually and then wipe the sample from the target manually after each analysis. Additionally, the fiber optics used in some of these instruments are subject to deterioration. Further, some devices still require scientists to manually record testing data.
A new type of automated UV-VIS spectrophotometer has entered the life sciences market that is designed specifically for quantitating nucleic acids or fluorescently labeled nucleic acids, as well as proteins. The instrument provides scientists with a system that eliminates tedious manual operations and, more importantly, increases the accuracy and reproducibility of testing results.
The automated UV-VIS spectrophotometer provides the benefit of drop-and-click mounting measurement and a self-cleaning sample pedestal. Manual operations, such as moving the optical head or cleaning parts that come in contact with the sample, are no longer necessary. Further, it improves lab efficiency by permitting a 3-sec analysis time and a 10-sec cycle time between samples.1
To show the flexibility of an automated UV-VIS spectrophotometer in the quantitation of DNA, researchers tested double-stranded calf thymus DNA (Sigma-Aldrich, St. Louis, MO).
Experimental conditions
The researchers carried out a series of dilutions on the DNA standards, providing concentrations in the range of 2–3500 ng/μL. They were measured using the 0.2-, 0.7-, and the optional 5-mm pathlength cells. The detection limits (ng/μL) for each pathlength are shown in Table 1. Data analysis was carried out using the software provided with the instrument.
Table 1 – Detection limits and dynamic ranges by pathlength for dsDNA samples

The formula that was used for determining the concentration was: sample concentration = dilution factor X (OD260-OD320) × nucleic acid concentration factor (50), where OD is the optical density. The nucleic acid concentration factor is set in accordance with the analyte selected.
The automatic wiper feature was used to clean the target surface, eliminating the need for time-consuming manual cleaning techniques used in other instruments. All measurements were repeated three times or more. The detection limit was determined with an 85% confidence limit from the following equation:
In this equation, is the detection limit,
 is the confidence limit based off of the number of degrees of freedom,
 is the standard deviation of the blank, and ns and nb are the number of observations on the sample and blank, respectively.2
Figure 1 is a plot of the acquired data using an automated UV-VIS spectrophotometer after measuring dsDNA with the 0.7-mm pathlength setting. As seen from the plot, with this pathlength, the instrument demonstrates a linear dynamic range from 6.58 to 842.50 ng/μL.
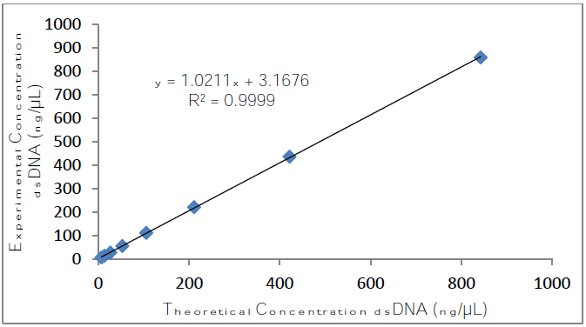 Figure 1 – Graph of the experimental concentrations plotted as a function of the theoretical values acquired using the 0.7-mm pathlength.
Table 2 shows the average dsDNA concentration values obtained from an automated UV-VIS spectrophotometer using a 0.7-mm pathlength. Table 3 demonstrates the blank values recorded by an automated UV-VIS spectrophotometer in ng/μL for the 0.7-mm pathlength.
Table 2 – Average dsDNA concentration values obtained from the automated UV-VIS spectrophotometer using a 0.7-mm pathlength
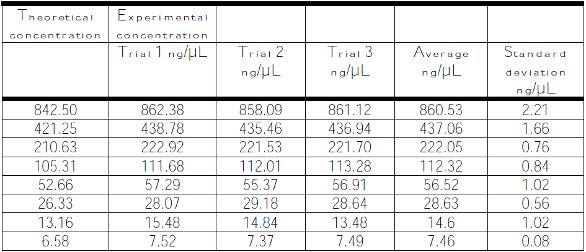
Table 3 – Blank values recorded by the automated UV-VIS spectrophotometer in ng/μL for the 0.7-mm pathlength

The instrument demonstrates detection limits of 0.15, 0.4, and 0.89 ng/μL for the 5-mm, 0.7-mm, and 0.2-mm pathlengths, respectively. The adjustable pathlength capability of the automated UV-VIS spectrophotometer allowed for accurate measurement of samples across the full concentration dynamic range. Concentrations were calculated by the software in the defined concentration range for each respective pathlength setting.
UV-VIS spectrophotometers in protein quantitation
The focus of this study was the quantitation of protein using the 0.2- and 0.7-mm pathlength settings with linear ranges and detection limits shown in Table 4.
Table 4 – Linear dynamic range and detection limits of the automated UV-VIS spectrophotometer by pathlength for protein samples3

Experimental conditions
All measurements were carried out using protein standard (Sigma-Aldrich). The protein was dissolved in 100 μL of phosphate buffered saline (Dulbecco’s Phosphate Buffered Saline [DPBS] Modified). The molar absorptivity (ε) of the protein standard was 43,824 M–1 cm–1 with a molecular weight of 66,400 g/mol.4 An initial stock protein concentration was prepared at 20.5 mg/mL. A series of dilutions were carried out on the protein standard providing samples with concentrations in the range of 1.3–20.5 mg/mL for the 0.2-mm pathlength and 0.6–20.5 mg/mL for the 0.7-mm pathlength.
All measurements were repeated 10 times. The automatic wiper feature was used to clean the target surface, thus eliminating the need for time-consuming manual cleaning techniques. Although the instrument linear range extends to 114 mg/mL, this study focused on a maximum protein concentration of 20 mg/mL.
Results: Dynamic range
Table 5 shows the protein concentrations using the 0.2-mm pathlength setting in the concentration range of 1.3–20.5 mg/mL. Figure 2 displays the experimental average protein concentration plotted as a function of theoretical concentration using the 0.2-mm pathlength setting. As seen, the automated UV-VIS spectrophotometer demonstrates linearity of 1.3–20.5 mg/mL when using a pathlength of 0.2 mm.
Table 5 – Theoretical and average protein concentrations reported by the automated UV-VIS spectrophotometer measured with a 0.2-mm pathlength

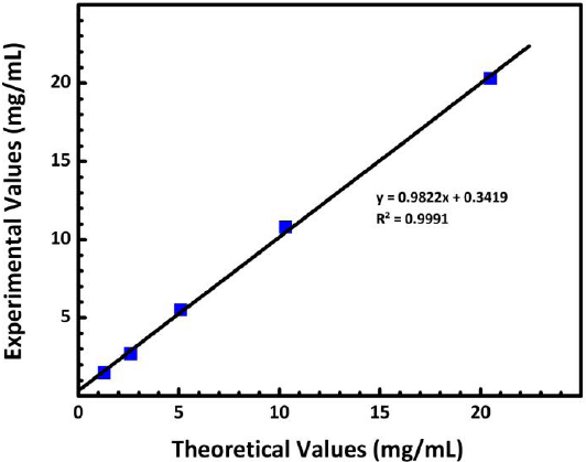 Figure 2 – Experimental protein concentrations reported by an automated UV-VIS spectrophotometer when using the 0.2-mm pathlength plotted as a function of the theoretical concentrations.
Table 6 shows the protein concentrations reported by the automated UV-VIS spectrophotometer using the 0.7-mm pathlength setting in the concentration range of 0.6–20.5 mg/mL.
Table 6 – Theoretical and average protein concentrations reported by the automated UV-VIS spectrophotometer measured with a 0.7-mm pathlength
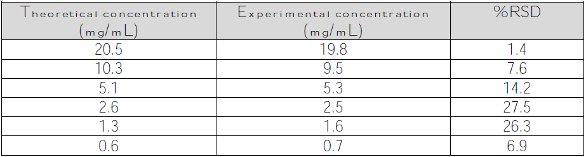
Figure 3 displays the experimental average protein concentration plotted as a function of theoretical concentration using the 0.7-mm pathlength setting. As seen from the figure, the spectrophotometer demonstrates a linear range of 0.6–20.5 mg/mL when using a pathlength of 0.7 mm.
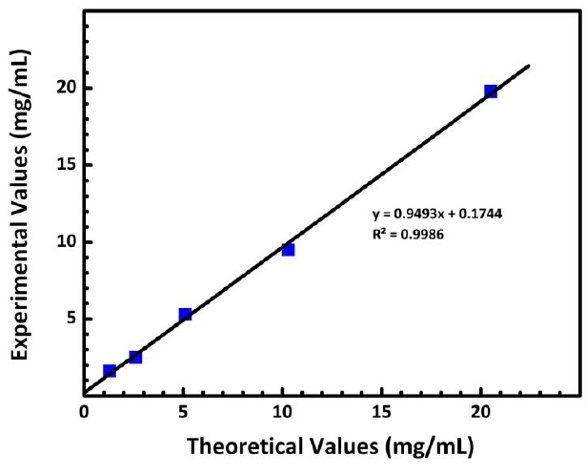 Figure 3 – Experimental protein concentrations reported by the automated UV-VIS spectrophotometer when using the 0.7-mm pathlength plotted as a function of the theoretical concentrations.
Results: Detection limits
The detection limits listed in Table 4 were determined with an 85% confidence limit from the following equation5:
Table 7 – Average and standard deviations for blank measurements for the 0.2- and 0.7-mm pathlengths
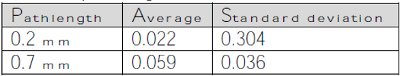
In this equation, is the detection limit, is the confidence limit based off of the number of degrees of freedom, is the standard deviation of the blank, and ns and nb are the number of observations on the sample and blank, respectively. Table 7 displays the average and standard deviation values of the blank measurements recorded by the automated UV-VIS spectrophotometer when measuring the phosphate buffered saline 10 times for each pathlength setting.
Conclusion
The results show that concentration measurements using an automated UV-VIS spectrophotometer are accurate and highly reproducible. Additionally, the automatic wiping mechanism is extremely beneficial because it saves operators from performing repetitive, time-consuming cleaning of liquid-contact parts, as well as manual manipulation of the optical head.
Thus, with the new semiautomated microliter-type spectrophotometer, productivity is greatly enhanced, giving scientists the ability to perform and store up to six analyses per minute without any reduction in accuracy and precision.
References
- BioSpec-nano Instruction Manual, 206-97213C.
- Peters, D.G.; Hayes, J.M. et al. Chemical Separations and Measurements‒Theory and Practice of Analytical Chemistry; W.B. Saunders: London, 1974; p 29.
- BioSpec-nano Electronic Instruction Manual, Software Version 2.02.
- Fasman, D.G., Ed. Practical Handbook of Biochemistry and Molecular Biology; CRC Press: Boston, MA, 1992.
- Peters, D.G.; Hayes, J.M. et al. Chemical Separations and Measurements‒Theory and Practice of Analytical Chemistry; W.B. Saunders: London, 1974; p 29.
Andrew Shaff, B.S.; Jeff Head, M.S.; and John Kinyunjui, Ph.D., are Product Specialists, and Mark Talbott, Ph.D., is Product Manager for the Molecular Spectroscopy Group, Shimadzu Scientific Instruments, 7102 Riverwood Dr., Columbia, MD 21046, U.S.A.; tel.: 800-477-1227; e-mail: [email protected].