We believe that detection limits (DLs) should go away. Please excuse us for being blunt as we begin the new topic of detection, but this first sentence is our considered opinion. The concept of DLs is an artificial one that has roughly as many definitions and formulas as there are people who talk about and calculate such numbers. DLs can be described statistically (as will be discussed in subsequent articles in this series). However, such fundamentals are typically ignored by many practitioners; instead, these limits are calculated by various methods that often are unrelated and sometimes are not revealed to the end user. Not infrequently, detection limits are used as reporting limits. Inevitably, discussions devolve into a quest for the detection limit; such a value does not exist!
Instead, we encourage the scientific community to adopt a policy of reporting every measurement result (which has been obtained without extrapolation of any related calibration/regression curve) with a statistically sound estimate of its uncertainty (at a given confidence level). Then the customer truly would have the data needed to make sound judgment calls. However, people typically shy away from making decisions for which they could be held accountable, perhaps helping to explain the perpetuation of the status quo.
Having stated our opinion, we now will step down from our soapbox and admit that our call for a “DL-less” world is merely wishful thinking. These limits are too firmly entrenched in the analytical world, and their demise would cause a great deal of consternation. Recognizing this reality, we hope to use subsequent articles to lay a statistically sound foundation for understanding the world of detection, and to relate various DL-calculation methods to this base.
To begin thinking about detection, step outside the laboratory and enter any airport in the country. Anyone who intends to fly on a commercial aircraft will first have to pass through a metal detector. The screener’s objective is to prevent people from taking on board anything that could be used as a weapon. To keep from missing something dangerous, the machine should be able to spot small objects. Concurrently, the screeners do not want to miss a problem item (such a mistake could lead to fatal consequences). However, another desire is to minimize the number of times insignificant items trigger the alarm, thereby requiring additional screening and annoying the traveling public. Nevertheless, when the alert level is high, finding as many weapons as possible becomes much more important than slowing down screening lines.
Turn now to another scenario that is also part of everyday life, but which involves laboratory results. Everyone who donates blood will have a sample taken for testing. The goal is to screen out people who have diseases that could harm potential recipients. Inevitably, the tests should be able to find very small amounts of evidence for such conditions. If infected blood is not discovered, a recipient patient might die. On the other hand, if healthy donors are erroneously told they are carrying a disease, these people are subjected to additional tests and emotional upheaval , and may never donate again.
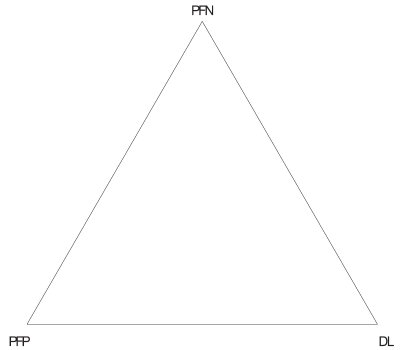
The bottom line from both of these examples is that there are tradeoffs when using a procedure that needs to measure small amounts of a substance. In other words, there are tradeoffs in the world of detection, even in everyday life. It turns out that three concepts are involved: 1) the low level the user wants to be able to detect, 2) the desire not to miss something important, and 3) the desire not to flag something that is insignificant. In the statistical world, these three descriptions are called (respectively): 1) the detection limit, 2) the probability of false negatives (PFN), and 3) the probability of false positives (PFP).
Most users of DLs are comfortable with the idea that these limits are related to PFPs; many calculations include the setting of this probability, typically to 1%. What may come as a surprise to some persons is the inclusion of PFNs. Indeed, a dichotomy seems to exist between those analysts who agree the PFNs (and PFPs) need to be part of the detection world, and those persons who think PFPs are sufficient.

Figure 1 - Diagram showing that in the world of detection, the: 1) probability of false negatives (PFN), 2) detection limit (DL), and 3) probability of false positives (PFP) are all related to each other.
A mathematical equation can be derived from calibration prediction intervals to relate DLs, PFNs, and PFPs. The equation will be shown in a future article. For now, it is sufficient just to know that the relationship exists (see Figure 1). It is quite possible to calculate a DL while considering only the PFP, but this fact does not mean that the PFN does not exist just because it was ignored. The PFN can (and should) be calculated to see the entire picture. This three-way relationship will be developed more fully in the next article. In the meantime, keep Figure 1 in mind, since the relationship among these three variables is key to understanding the world of detection.
Mr. Coleman is an Applied Statistician, Alcoa Technical Center , MST-C, 100 Technical Dr., Alcoa Center, PA 15069, U.S.A.; e-mail: [email protected]. Ms. Vanatta is an Analytical Chemist, Air Liquide-Balazs™ Analytical Services, Box 650311, MS 301, Dallas, TX 75265, U.S.A.; tel.: 972-995-7541; fax: 972-995-3204; e-mail: [email protected].