Raman spectroscopy is a useful tool for differentiating sugars and other sweeteners used in pharmaceutical and chemical manufacturing. Using a simple set of rules available with the Raman spectroscopy instrument described in this article, a laboratory technician was able to build a set of robust methods to differentiate these common additives.
Use of sweeteners in the food, chemical, and pharmaceuticals industries
The question of sweetness is something many consumers take for granted, yet the sweetener choices are abundant with many nutritive and nonnutritive options. There are many purposes for sweeteners. Pharmaceutical drug makers use them as preservatives, stabilizers, and masking agents for medications. Chemical manufacturers use them in reactions as a raw material. Food makers use them to add flavor. Sugars and sugar substitutes come in many forms that range from crystalline powders to transparent liquids with colors from white to yellow to brown. New processing techniques have changed some of the characteristics of what sugars look like, making finer grains and dryer mixtures available to produce a difference in “feel” or appearance than what was experienced in the past.
Supply chain security issues have been headline news lately and raise the question: How do we really know that the sweetener we are placing in our product is in fact the ingredient we think it is? This article will look at how a rapid, nondestructive, Raman spectroscopy technology can easily differentiate solid form sweeteners from each other and give positive proof of the sweetener identity.
Background
Sugar is a generic term for saccharide and there are three general groups of saccharides: monosaccharides, disaccharides, and polysaccharides. Monosaccharides are the simplest carbohydrate forms and consist of single sugar moieties that become the building blocks for the other saccharide groups. The most common monosaccharides are fructose (fruit sugar), glucose (dextrose), galactose (breast milk sugar), xylose (wood sugar), and ribose (genetic sugar). Disaccharides contain two monosaccharides or twice the sugar moieties. The most common are sucrose (fructose + glucose), lactose (galactose + glucose), maltose (glucose + glucose), and trehalose (glucose + glucose). Polysaccharides are characterized by a repeating pattern of polymerized monosaccharides or disaccharides and result in materials such as cellulose, starches, and glycogen. The saccharides are generally found in abundance in nature and are produced commercially in millions of tons every year.
Sweeteners also encompass nonnutritive products that are not considered saccharides and do not contribute significantly to blood glucose levels and thus are referred to as sugar substitutes. Sugar substitutes generally fall into two classes: high-intensity sweeteners and sugar alcohols, also known as polyols. The common high-intensity sweeteners are saccharin, aspartame, acesulfame potassium, neotame, sucralose, and extracts from stevia. With the exception of stevia extracts, the high-intensity sweeteners are artificially made through a variety of chemical processes. Stevia is extracted from one of many varieties of the stevia plant and is composed of a group of glycosides, such as stevioside and rebaudioside.
High-intensity sweeteners are so called because they exhibit sweetness indices ranging from 200 to many thousands of times greater than glucose. Because of the large difference in sweetness index for the high-intensity sweeteners, they are often mixed with other sugars that are less sweet to provide volume in consumer applications. Two of these diluted mixes were evaluated in this study.
Sugar alcohols are often found in nature, but are usually artificially manufactured because it is impractical to extract them from the natural source. Sugar alcohols are hydrogenated sugars. Hydrogenation changes the aldehyde group to an alcohol group on the molecule by adding two hydrogen atoms. The process of hydrogenation of glucose produces sorbitol, lactose produces lactitol, and xylose produces xylitol as examples.

Experimental
Materials
For the purposes of this study we will focus on the monosaccharides and disaccharides as well as a small selection of the sugar alcohols and high-intensity sweeteners. Table 1 lists the compounds used for this study.
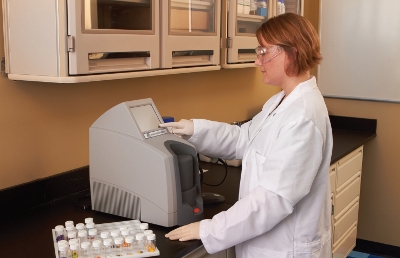
Figure 1 – Verifier Tri-Test 1000.
Methods
A library entry was built for each of the materials using the Verifier™ Tri-Test 1000 instrument (Figure 1) from Mustard Tree Instruments (Research Triangle Park, NC). From this library entry, a method was created with specific selection rules enabling the instrument to give a pass or fail result against that method containing the reference sample. All study materials were tested against each method to produce a pass and fail response. The setting of these rules was intentionally limited to a single rule at the beginning of this study as part of the design of experiment (DOE). The method creation process can be iterative by incorporating additional rules to “tune” the system to optimize Type I and Type II errors.
Data analysis
Samples were run in replicates of 10 to ensure statistical validity. Type I (false positive) and Type II (false negative) results were recorded. The results are shown in Table 2 with one axis consisting of samples and the other consisting of methods. A consistent 10 of 10 replicate pass result is recorded in green, and a 10 of 10 replicate fail result is recorded in red. Anything other than a 10 of 10 outcome would have been recorded as yellow.
Results and discussion
The average time to build a library entry and then a method was about 10 min. This involved running the reference standard to produce a high-quality library entry and then running a sample against the method for 10 replicates to determine first iteration of appropriate selectivity rules. The spectrum of the standard was observed and the peaks counted. The method rule was asked to match a subset of major peak locations. Due to naturally derived materials having backgrounds that may cause variation in peak heights, it was not essential that all ranked peaks are found to match. Raman spectroscopy has sufficient selectivity, permitting good differentiation with simple rule sets.

During this study, some 19 sweeteners were run each against 19 methods and replicated 10 times for a total of 3610 Raman comparisons. An additional group of compounds was also tested against the sweeteners representing three common low-molecular-weight starches (polysaccharides). They are depicted in the lower box of Table 2. This brought the total number of sample runs to 4180. The average run time for each sample was approximately 30 seconds. This included the loading of the samples into the sample carousel, selection of the method, running of the method, and review of the results. The barcode reader on the Verifier Tri-Test 1000 enabled rapid and error-free entering of sample ID number. The total time to execute this study was approximately seven working days. The laboratory technician conducting this analysis did not have any spectroscopic training.
As can be seen from the visual representation in Table 2, the results were consistent and predictable. The Type I and Type II error rate cumulatively for all methods against all samples represented in Table 2 is 0% for a single rule iteration with less than an hour of initial training.
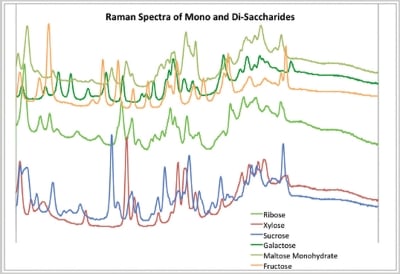
Figure 2 – Raman spectra of common saccharides.
An examination of representative spectra (Figure 2) indicates why the results were so definitive. The sweetener spectra have an abundance of peaks and the selectivity rules can easily differentiate same from similar. This makes identification very straightforward and analytically simple.
Conclusion
All analytical testing techniques have iterative methods development, and the main reason for this is to optimize result output, in this case to minimize false positive or false negative identity outcomes. The setting of selectivity rules was intentionally limited to a single rule to test the simplicity of the setup of the device. The power can be seen in the ease of differentiating even hydration states of commonly used ingredients (Figure 3). The addition of other rules such as measuring color, limiting the Raman comparison to a particular region of the spectrum, ratio of relevant peaks, and much more is possible with the device to differentiate compounds with very similar spectroscopic properties.
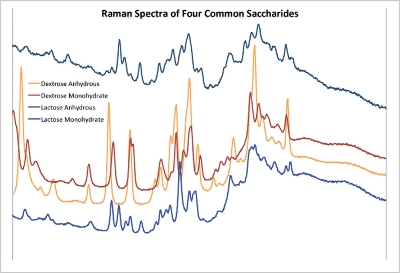
Figure 3 – Spectral representation of saccharide hydration states.
Sweeteners are very similar to each other, in some cases being the same in chemical composition and molecular weight. Many of the materials in the study have the same chemical formulas, differing only in molecular structure or a single chemical bond variance. Identification and differentiation of these compounds then necessitates use of technology that can structurally elucidate or at least differentiate.
Complicating matters is that sweeteners may be enantiomers (mirror image compounds or optical isomers) so having identical molecular properties except in optical orientation. Optical isomers, although exhibiting subtle differences in structure, may have dramatic impact on human or animal health, with D-glucose being nutritive while L-glucose is not, for instance. Differences in physical form such as crystal structure or hydration state may affect bioavailability, solubility, the sense of sweetness, as well as measurement weight, which are all important properties to be considered for manufacturing.
Raman spectroscopy, specifically the Verifier Tri-Test 1000, can be used effectively to identify sweeteners of all varieties definitively and in short order. It can differentiate between solids, hydration states, molecular weights, chemical composition, different structures, as well as small compositional changes of high-intensity sweeteners. The Raman-based ID test is rapid and nondestructive, allowing the sample to be reused later for other purposes. The testing and identification accuracy of Raman is extraordinary and should be considered to improve detection of potential counterfeits or contaminants.
Todd Blonshine is Chief Executive Officer, Mustard Tree Instruments, 10 Laboratory Dr., P.O. Box 14527, Research Triangle Park, NC 27709, U.S.A.; tel.: 919-972-7920; e-mail: [email protected]; www.mustardtree.com.