Electrochemical analysis (or electroanalytical chemistry) is an important division of analytical chemistry, and is introduced in laboratory-oriented courses for graduate students in electrochemistry or related fields. The small amplitude triangular wave potential sweep method, as a basic electroanalytical technique for measurement of electrochemical reaction resistance and double-layer capacitance, is usually taught in these courses and is widely used by technicians in this field. However, although the large amplitude triangular wave potential sweep method (cyclic voltammetry) is demonstrated and discussed in detail, the small amplitude method is not explained thoroughly in many electrochemical analysis textbooks,1–5 and this may lead to misunderstanding and incorrect application.
This article describes a general current-potential equation corresponding to small amplitude triangular wave potential sweep measurement results. The effect of solution resistance on the Rr and Cdl is discussed by using a computational system. This will hopefully provide students and technicians with a better understanding of this electrochemical method and thus improve measurement accuracy.
Nomenclature
Cdl — Double-layer capacitance (Fcm−2)
F — Faraday constant (96,485 Cmol−1)
φ, φe — Potential and equilibrium potential (V)
i, i0 — Current density and exchange current density (Ωcm−2)
n — Number of electrons involved in the electrochemical reaction
Rs, Rr — Solution resistance and charge-transfer resistance (Ωcm2)
R — Gas constant (8.314 Jmol–1 K–1)
t —Time (s)
T — Temperature (K)
v — Sweep rate
Rr and Cdl determination using electrochemical analysis
The small amplitude triangular wave potential sweep method is a common electrochemical analysis technique used to determine the electrochemical reaction resistances, exchange current densities, and double-layer capacitances of electrode systems. During the experiments, small amplitude triangular wave potential signals (shown in Figure 1a) were applied to electrode systems with electroanalytical instruments, such as an electrochemical workstation, and the response signals detected were i-φ curves, as shown in Figure 1b and c.
It is presented in many textbooks that for an electrode system without solution resistance (or negligible resistance), the detected i-φ curve must be as shown in Figure 1b. Due to the small amplitude of potential (Δφs = (φs – φe) <10 mV), the double-layer capacitance is regarded as constant. In addition, the electron transfer step is usually the determination step; thus the electrochemical reaction resistance can be calculated as:
Based on the curve in Figure 1a and b, the electrochemical reaction resistance and double-layer capacitance can be expressed as follows:
It can be seen from Eqs. (1), (2), and (3) that the electrochemical reaction resistance and exchange current density can be determined according to the slope of the line AB in Figure 1b, while the double-layer capacitance can be calculated based on the intercept of the line AB at the current axis (Figure 1b).
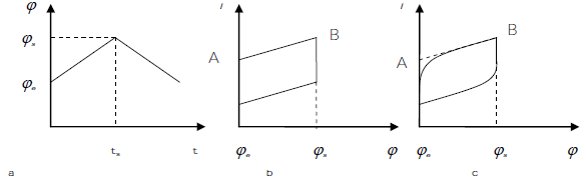
Figure 1 - Small amplitude triangular wave potential signals (a), and i-φ curves (b) and (c) detected during small amplitude triangular wave potential sweep tests.
For an electrode system with significant solution resistance, the detected i-φ curve is usually presented as in Figure 1c. In order to determine the Rr, a line AB can also be obtained by extending the linear part of the i-φ curve as shown in Figure 1c. The Rr can be calculated according to the slope of line AB, while the solution resistance must be considered as follows:
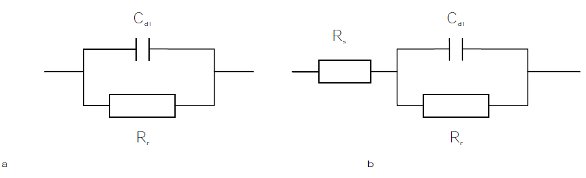
Figure 2 - Equivalent circuit model of electrode system without solution resistance (a) and with solution resistance (b).
Obviously, the influence of the solution resistance should also be considered when calculating the double-layer capacitance. However, in many textbooks, it is suggested that the double-layer capacitance can be directly calculated according to Eq. (3) under this condition.3–5 During the experiment, it was also found that few graduate students understand why Rr should be calculated according to Eq. (4) under this condition, and thus most of them calculate Rr according to Eq. (3) when a perfect linear i-φ signal is detected during measurement. This can be partially attributed to the fact that the textbooks present the equations for Rr and Cdl calculation without detailed discussion and deduction.
Establishing the i-t equation
For convenience sake, the following discussion is based on the first part of the potential signal (t ≤ ts) shown in Figure 1.
For the electrode system without solution resistance, its equivalent circuit model can be presented as in Figure 2a since the amplitude of potential (φs = φs – φe) is small during the experiments. Thus, the current density through the electrode can be expressed as:
Where Δφ = φs – φe = vt. Since the potential sweep rate is constant at t ≤ ts as shown in Figure 1a, this equation indicates that the current density increases linearly with increasing t, which is consistent with the i-φ curve shown in Figure 1b. As a result, Rr and Cdl can be calculated according to the slope and intercept of line AB, respectively.
For the electrode system with significant solution resistance, its equivalent circuit model can be presented as Figure 2b. The current density is influenced by the solution resistance:
Considering Δφ = φs – φe = vt and v = dφ/dt, the equation can be expressed as:
Using the initial condition t = 0, i = 0, the Laplace transform of Eq. (6) is:
Where p is the Laplace transform variable. The inverse Laplace transform can be carried out with the convolution rule, and thus,
Eq. (7) shows that i increases exponentially with Δφ (or sweep time) increasing at the initial stage, and after a transition time, increases linearly at the last stage. This is consistent with the general i-φ curve shown in Figure 1c.

Figure 3 - Simulation i-φ curves for electrode systems with different solution resistance.
Simulation and procedures for Rr and Cdl determination
To improve understanding, based on Eq. (7), POLYMATH software (Polymath Software, Willimantic, CT) was used for simulation of general i-φ curves obtained by the small amplitude triangular wave potential sweep method. The Rr, Cdl, potential sweep rate, and amplitude are 40 W, 0.3 mF, 1 V/s, and 10 mV, respectively. The simulation curves are shown in Figure 3.
As can be seen in Figure 3, high-solution resistances influence not only the slopes but also the intercepts at the current axis of the linear parts of the i-φ curves, indicating that electrode systems with the same Rr and Cdl may exhibit different slopes and intercepts during small amplitude triangular wave sweep measurement. Therefore, Eqs. (2) and (3) are not suitable for calculating Rr and Cdl in this case. According to Eq. (7), the two equations must be rewritten as:
Obviously, Eqs. (4) and (8) can be simplified to Eqs (2) and (3), respectively, if Rs<<Rr. Otherwise, Rr and Cdl should be calculated according to Eqs. (4) and (8), respectively. This suggests that for an electrode system with a large exchange current density (a small electrochemical reaction resistance), even a very small solution resistance may have a significant effect on the Rr and Cdl values calculated according to Eqs. (2) and (3).
More importantly, it is worth noting that, according to Eq. (7), if Rs> Rr, the detected i-φ curve may become a perfect line, as shown in Figure 3, but the Rr and Cdl must also be calculated according to Eqs. (4) and (8).
Conclusion
The general i-φ curve obtained using the small amplitude triangular potential sweep method was analyzed, and a corresponding i-φ equation was established, so that graduate students and technicians would gain a better understanding of the method and improve the measurement accuracy. Based on Eq. (7), POLYMATH software was used for simulation of the i-φ curves of electrode systems with different solution resistances. The results show that the solution resistance influences not only the slope, but also the intercept at the current axis of the linear part of the i-φ curve. Procedures are proposed for calculating the Rr and Cdl of electrode systems with significant solution resistance.
References
- Bard, A.J.; Faulkner L.R. Electrochemical Methods, Fundamentals and Applications, 6th ed.; John Wiley & Sons, Inc.: Hoboken, NJ, 1998; pp 226–55.
- Wang, J. Analytical Electrochemistry, 3rd ed.; John Wiley & Sons, Inc.: Hoboken, NJ, 2006; pp 29–41.
- Jia, Z.L.; Dai, C.S.; et al. Electrochemical Measurement Methods, 1st ed.; Chemical Industry Press: Beijing, China, 2006; pp 126–9.
- Hu, H.L.; Li, N. Electrochemical Measurement, 1st ed.; National Industry Press: Beijing, China, 2007; pp 157–9.
- Shu, Y.D.; Chen, B.Z. Electrochemical Analysis Methods, 1st ed.; Central South University Press: Changsha, China, 1990; pp 209–14.
Ya Chen, Ph.D., is Lecturer, School of Metallurgical Science and Engineering, Central South University, Changsha 410083, China; tel.: +86 731 88877352; e-mail: [email protected].