As a common intermediate in the synthesis of numerous pharmaceuticals, α-bromobutyric acid displays chirality at the carbon bound to the bromine. Thus, a method to determine the optical purity is of interest. In early chiral separations, the enantiomeric separation of α-bromobutyric acid was basically performed using gas chromatography, 1–5 which depended on related chiral reagents or chiral stationary phases. Other methods were also reported for the resolution of α-bromobutyric acid with bacterial dehalogenases6 or with nuclear magnetic resonance (NMR) spectroscopy via triphenyltin derivatives of α-bromobutyric acid.7 Among the available methods for the separation of enantiomers, HPLC with chiral stationary phases (CSPs) is the most rapid and efficient.8,9
The liquid chromatographic enantioseparation of α-bromobutyric acid has not yet been reported. This article describes an LC method combined with pre-column derivatization to obtain effective enantioselective discrimination. The carboxyl group of α-bromobutyric acid was reacted with aniline in the presence of N,Nʹ-methanetetraylbis-cyclohexanamine (DCC), leading to the formation of derivatives, which were then separated with a chiral LC column.
Experimental
Chromatography
LC was performed with an LC-20AT pump and an SPD-M20A photodiode array detector (both from Shimadzu, Kyoto, Japan), a model OR-2090 optical rotation detector (JASCO, Tokyo, Japan), and an HCT-360 LC column cooler/heater (Automatic Science, Tianjin, China). A Class-VP™ workstation (Shimadzu) was used for data acquisition. The following columns were used for the separation: Chiralcel OD-H (250 × 4.6 mm, 5 μm) (Daicel Chemical Industries Ltd., Tokyo, Japan), dinitrobenzoyl (DNB)-leucine (250 × 4.6 mm, 5 μm), DNB-phenylglycine (250 × 4.6 mm, 5 μm), an π-electron acceptor/π-electron donor phase (250 × 4.6 mm, 5 μm), and a chiral HPLC packing based on the network polymer derived from L-tartaric acid (250 × 4.6 mm, 5 μm). Chromatographic separations were investigated with mobile phases consisting of n-hexane:2-propanol or ethanol (95:5 or other v/v) at 30 ºC. The flow rate was 1.0 mL min–1 and the UV detector was kept at 254 nm. Void times were determined using ethanol as a marker. Sample solution was prepared by dissolution in n-hexane at 50 μg mL–1. The injection volume was 5 μL.
Derivatization procedure
A mixture of D,L-α-bromobutyric acid (0.11 mL, 0.001 mol) (Alfa Aesar, Ward Hill, MA) and DCC (0.25 g, 0.0012 mol) (Sinopharm Chemical Reagent Co., Ltd., Shanghai, China) in CH2Cl2 (30 mL) was stirred at room temperature for 5 min; then aniline (0.09 mL, 0.001 mol) was added (Kelong Fine Chemical Factory, Chengdu, China). After additional stirring for 5 hr at 30 ºC, the solvent was washed with 1 M HCl, 1 M NaOH, and water, respectively, and then dried with sodium sulfate. The mixture was filtered and the filtrate was evaporated to dryness under reduced pressure.
Results and discussion
Choice of chiral stationary phase
Five different columns—Chiralcel OD-H, DNB-leucine, DNB-phenylglycine, π-electron acceptor/π-electron donor phase, and a chiral HPLC packing based on the network polymer derived from L-tartaric acid—were studied to determine the resolution and retention of the derivatives of α-bromobutyric acid enantiomers. As shown in Table 1, the derivatives cannot be separated on DNB-leucine, DNB-phenylglycine, and the π-electron acceptor/π-electron donor CSPs. Retention time of the derivatives on the CSP based on the network polymer derived from L-tartaric acid was longer than those on Chiralcel OD-H, while the capacity factor on the former was less than that on the Chiralcel OD-H. Therefore, the separation, retention, and elution order of the derivatives on the Chiralcel OD-H should be investigated further.
Effect of organic modifier

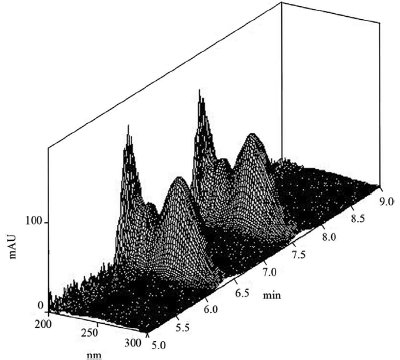
Figure 1 - Chromatogram of the enantiomers of α-bromobutyric acid derivatives under photodiode array detection. Conditions: stationary phase, Chiralcel OD-H; mobile phase, n-hexane:2-propanol (85:15, v/v); flow rate, 1.0 mL min–1; column temperature, 30 ºC; UV detection wavelength, 245 nm.
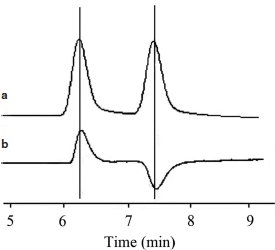
The type and concentration of organic modifier were found to influence the enantioseparation of the derivatives of α-bromobutyric acid enantiomers. The selectivity and resolution of the derivatives with modifiers ethanol and 2-propanol on an OD-H column are shown in Table 2. Both organic modifiers have shown good selectivity for the derivatives, and 2-propanol demonstrated better enantioselectivity. Thus, 2-propanol was chosen as the organic modifier. Upon decreasing the concentration of organic modifier, the capacity factors and the resolutions increased. Considering a compromise between resolution and retention time, 15% of 2-propanol in n-hexane was found to be an optimum mobile phase for analysis. Typical chromatograms are presented in Figures 1 and 2. It was found that the (+)-enantiomer eluted before the (–)-enantiomer.

Figure 2 Chromatogram of the enantiomers of α-bromobutyric acid derivatives obtained by use of UV detection (a) and optical rotation detection (b). Conditions: stationary phase, Chiralcel OD-H; mobile phase, n-hexane:2-propanol (85:15, v/v); flow rate, 1.0 mL min–1; column temperature, 30 ºC; UV detection wavelength, 245 nm.
Effect of temperature
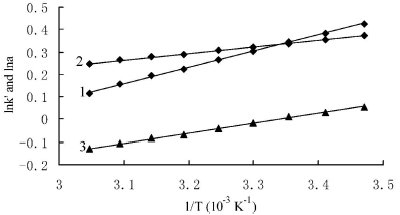
In order to study the chiral recognition mechanism further, the effects of column temperature on the retention and enantioseparation were investigated. The apparent thermodynamic parameters can be estimated from the following two relationships:10,11

Figure 3 - Plot of lnkʹ and lnα versus 1/T. 1) Plot of lnk2ʹ versus 1/T; 2) plot of lnα versus 1/T; 3) plot of lnk1ʹ versus 1/T.
Where Δ(ΔH) and Δ(ΔS) represent the differences of ΔH and ΔS for a given pair of enantiomers, respectively. Table 3 shows the effects of column temperature on the retention and enantioseparation when the mobile phase was composed of n-hexane:2-propanol (85:15, v/v). The kʹ values decreased when the column temperature was increased for all compounds. The plots of lnkʹ against 1/T were highly linear in the temperature range 288–328K (15–55 ºC) (Figure 3), with the linear regression equation ln α = 0.2911x–0.6386 (R2 = 0.9980), lnk1ʹ = 0.4381x–1.4638 (R2 = 0.9987), and lnk2ʹ = 0.7292x–2.1024 (R2 = 0.9993), which suggests that the conformation of the CSP does not change in substance within the temperature range. The corresponding thermodynamic parameters, ΔH and ΔS*, could then be calculated from the plot. The ΔH values of the derivatives were –3.64 kJ mol–1 and –6.06 kJ mol– 1. The Δ(ΔH) and Δ(ΔS) values of the derivatives were –2.42 J mol–1 and –5.31 J mol–1 K–1. The Δ(ΔH) and Δ(ΔS) values were all negative, which suggests that the enantioseparation is enthalpy driven.